The Scale of Things
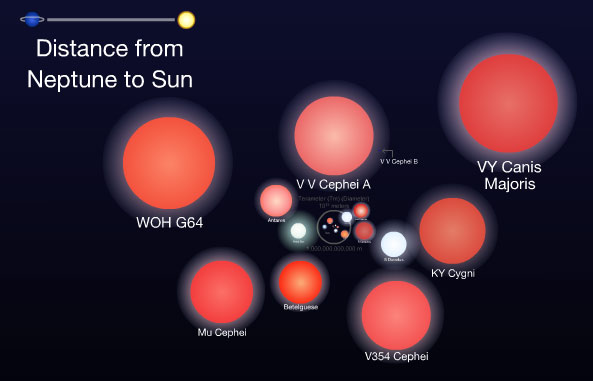
Cosmology is about the largest scales (and times) in the Universe. What the hell does that mean? Well, if you play with the interactive flash on the right, and you focus on the scales that are 1022 m and larger, you're looking at cosmology.
The weird thing is that understanding those scales requires we investigate the other end of the spectrum, too: not just the behavior of atoms and electrons (10-10 m) but all the way down to the Planck length (10-35 m). Cosmology is really the audacious study of everything which is why it's taken so long to get away from reassuring yet completely fabricated theological stories told around our ancestors' campfires and become a legitimate science. We have truly entered an amazing time in human history (which has only been about 1011 seconds so far) where our imaginations and intelligence have begun to comprehend it all. There's plenty of work left to do: we don't have a satisfying explanation for the Standard Model of Particle Physics yet (at the small end of the scale), nor a reasonable explanation of what dark matter is (also part of the small end of the scale, but it affects the biggest ends) or dark energy (we really don't know what this is yet!). So despite what Marx might have said, we are not reaching the "end of history." We are only beginning.
Click to go to the website
Topics we will cover...
Cosmology is the study of everything. This seemingly ridiculous statement will make more sense as the semester progresses, despite the obvious hubris. It is amazing that our ancestors on the savannahs of Africa evolved brains clever enough to study and model the universe on vast and miniscule scales. After all, during our daily lives we can only experience scales on the order of fractions of a millimeter (10-4m or so) up to at most, hundreds of kilometers (105m). There's no a priori reason evolution should equip us to comprehend anything on the scale of galaxies (~1020m) or quantum mechanics (~10-10m), let alone the smallest conceivable scale (~10-35m, something we'll talk about later, the Planck scale) or the scale of all visible spacetime (currently ~1026m), a.k.a., "The Universe." The same applies to timescales. Our experience is limited to coarse fractions of a second (~10-1s) up to maybe 100 years or so (~109s), but the smallest concievable amount of time (~10-44s, the Planck time) and the age of the Universe (~1017s) should be alien to our brains.
And they are at one level. Yet advances in observational technology and theoretical physics in the last century have brought our understanding of the entire visible Universe within reach of our minds.

Here are some mind-blowing videos made with either real data from the Sloan Digital Sky Survey (SDSS) or made using N-Body simulations. The similarities between the two types of visualizations strongly suggest we're getting something right about our models of How the Universe Got That Way (apologies to Kipling).
Keep in mind that a galaxy is almost a "single dot" to cosmologists, though they vary in size from 105 to 1011 stars...
If the videos don't show up in the next row, here are the links:
- Sloan Digital Sky Survey Fly through
- Old Sloan Digital Sky Survey Fly through which isn't complete (which is why you see big gaps), but does show how galaxies further away look different — and if you look far enough, there aren't any galaxies. The edge of the visible universe is the cosmic microwave background shown artistically here as a strange colorful sphere. We will understand that sphere much better much later in the semeseter.
- N-body simulations of the universe based on cosmological physics. By tuning the input parameters, we can recreate exactly what we see (galaxies) and why we see them in those configurations (the amount of dark matter).
The Hubble eXtreme Deep Field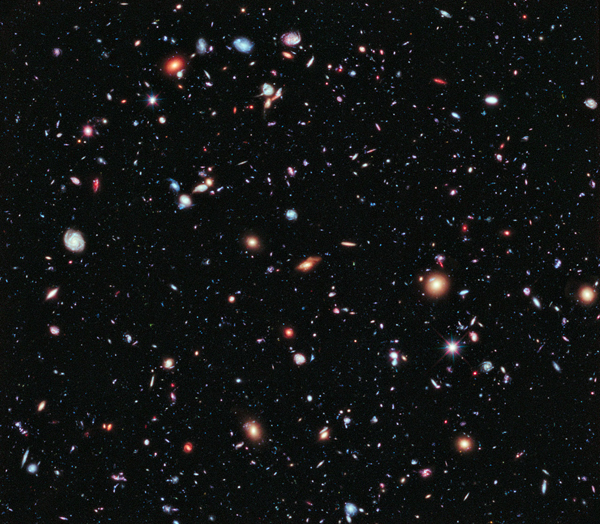 The Hubble eXtreme Deep Field (XDF) with about 5500 galaxies including some shining light from 450 million years after the Big Bang. Click to enlarge. Click here for a zoomable version! Or click here for Phil Plaitt's blog about it. | These kinds of images astound and amaze, but mostly humble us. Once we get over the humility, though, it's time for hubris! We demand answer to our questions!
We'll try to get a handle on all these things by studying physical cosmology (as opposed to theological cosmology where we can make up any old story we like.), a science which has started really coming into its own in the last 100 years, as Hubble, Rubin, Einstein, Gamow (Alpher & Herman, too), Penzias, Wilson, Wilkinson, Hawking, Smoot, Mather, Peebles, Perlmutter and Reiss (just to name a few!) along with hundreds of colleagues and grad students have peeled back the layers of evidence to derive and test our models of the entire universe's history. To paraphrase Margo Channing in All About Eve: "Fasten your seatbelts, it's going to be a bumpy class!" |
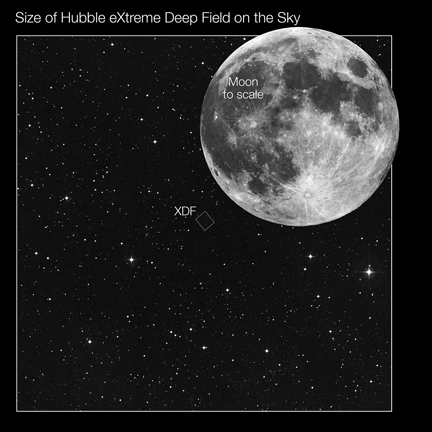
Comparison of the size of XDF
to the Moon. Click to enlarge.
Self Examination
Since you're the center of the universe, it's time you performed a little self examination. Here are some free downloadable programs that let you explore the visible universe in all its glory. Stellarium is free and also available for mobile apps and gives you a planetarium-like view of what the sky holds for any date and time from any place on Earth. Celestia actually lets you fly around (like the movies above) to investigate the crazy scales we deal with in class. Both are informed by real data, and have tons of metadata (i.e., click on a planet and it tells you details) loaded as part of the experience.
He was wrong to think he could now forget that the big, hard, oily, dirty, rainbow-hung Earth on which he lived was a microscopic dot on a microscopic dot lost in the unimaginable infinity of the Universe.
— Douglas Adams
So Long and Thanks for All the Fish

photo cr.
In class, we covered a fair amount of history (which is actually not addressed in great detail in your book). The main points to make are that what we can see with the naked eye is remarkably limited: the Sun, the Moon, a lot of dots, some of them colorful and the occasional smudge. Five of the dots move. That's not a lot to go on, but from this, clever Greeks (and others) figured out an awful lot of astronomy.
We drew a chronological (and oversimplified) line from Aristarchus, Eudoxus, Aristotle to Ptolemy and drew up a self-consistent view of the Universe which turned out to be wrong in some parts. But figuring out the distance to the Moon in Earth radii, as well as the size of the Earth reflects some of the best of what was right: and how to get there.
Aristotelean physics and the Ptolemy's geocentric model stood firm for over 1600 years or so. Others had certainly suggested heliocentrism (Aristarchus for one!) as a possiblity, but religious bias and natural human ego consistenly thwarted those efforts. It's not until Copernicus and friends in the late 1400's start to apply Occam's razor (look it up!) that science begins to insist there's a better way than just force-fitting observations with a priori bias from doctrine and dogma.
Tycho Brahe (born three years after Copernicus dies; picture on right) elevates the art and technology of measuring those dots and smudges to the point where observations of the heavens actually conflict with those doctrines and dogma. He notices that the parallax distances of comets as they move clearly show they're far away and that they travel through those "perfect transparent spheres" without any difficulty.
Science is a process more than a thing (though the word translates as just "knowledge"). And that process requires very specific things to work, not the least of which is imagination. The other buzzwords are important, of course, but if you have no curiosity and limited desire to "figure things out," then science just becomes a boring list of facts which seem to have nothing to do with daily life. What a sad (and incorrect) point of view that is.
Enough proselytizing. Here is a link to the history and "figure it out" slides about the distance to the Moon, the distance to the Sun and the size of the Earth. You are encouraged to work through these approaches until they make sense. Beneath a little bit of math lies a picture, worth far more than 1000 equations.

Angle, Shmangle
As emphasized in class, we need to rethink what angle means. You learned at your mother's knee that an angle is formed when two lines cross.

That's true, but for our purposes, astronomical and cosmological, it's good if we also realize an angle is a size divided by a distance.
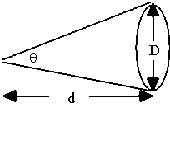 θ ≈ D/d
For that to be true, we can't use degrees anymore, and need to think about angles in terms of radians. We'll go back and forth unavoidably between degrees (and arcminutes and arcseconds) and radians (angle units as the Gods would have subtended...uh, I mean intended). It is up to you to make sure you can go back and forth as needed on your calculator between these two units.
Here's the conversion factor in a nutshell. "Radians" are the units of angle if you form the ratio of arclength to radius, in otherwords, a size (the length of arc) divided by a distance (from the center):
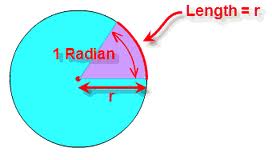 θ = arclength / r
The circumference of a circle is 2πr and the radius is r, so the ratio of circumference over radius is just 2π. In other words, all the degrees in a circle, 360o, must be equivalent to 2π radians (about 6.28 radians — hey! look the picture above, doesn't one radian look like about a sixth of the whole pie?). That's the conversion, then, between degrees and radians: 360o = 2 π radians = 6.28 radians (to three digit precision).
1o = 6.28/360 radians = 0.0174 radians
1 radian = 360/6.28o = 57.3o
Notice something else: the arclength, even of an angle as big as one radian, is only a little bit larger than the chord (the straight line). If you look at the image above that, "D" is like the chord of a circle and must be even closer in size to an arclength since the angle is smaller. Which leads to the next point: the "small angle approximation."
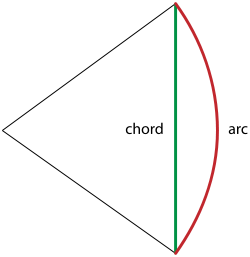 In case you forgot what a chord was...
As an exercise for the reader (namely to make you figure out the settings on your calculator), try taking the sine or tangent of a small number of radians. Like 0.5 radian (about 29o). Or 0.05 radians (about 3o). Notice your answer is pretty much the number you started with and that appoximation gets better and better as the angle gets smaller.
Of course it does. Look at what sin and tan physically are, and you can see that as the angle gets smaller and smaller, the chordlength and the vertical values (tan and sin) get closer and closer to being the same length as the arclength itself. So, sin and tan become indinstinguishable from the angle itself. BUT ONLY if you use radians.
sin θ ≈ tan θ ≈ θ (in radians)
Why do you care? Well, almost everything in astronomy subtends small angles. And this will also lead to interesting discussions later on how to use the apparent size of objects (i.e., the angle they subtend) as tests on some possible curvatures of space.
In the meantime, we also need to address parallax...
What you probably learned
at your Mother's knee
A different way to think about it
Hey, doesn't that look like
about 60o? (It's 57.3o)
Even for an angle as big
as 1 radian, the chordlength
is close to the arclength.
I am the Parallax, I speak for the stars...
Parallax distance is determined by noticing how much an object "wiggles" in our field of view as the Earth moves around the Sun compared to the background stars (which are so far away, we don't expect them to noticeably wiggle). The perfect analogy is that distant mountains don't seem to "move" even as you speed down the highway, but nearby telephone poles whiz by. Shown here is a star of frightening proximity (the parallax angle is large between the two viewpoints of the Earth six months apart).
Which brings up the question, what is the parallax angle of the closest exosolar star? Now you know what to do: the angle is the ratio of a size (the Earth's orbit's radius, "1 AU") to the distance to α-Centauri. A few caveats are in order here: as you can see in this diagram, the angle you use is half of what you might have expected. So the "size" part is exactly 1 AU (not 2 — i.e., use the radius of the orbit, not the diameter). The only problem is, we might have a mix of units: α-Centauri is 4 light-years away, and if we're to have a useful angle in radians, we need the same units for the "size" as for the distance.
The reason the Earth's orbit is "1 AU" in radius (ignore the ellipticity for a moment, any Keplerheads out there!) from the Sun is that people didn't know the exact distance to the Sun in meters. But even Kepler could figure out what the ratio of the various orbits was using parallax. So he did, and others have done so, using the Earth's orbit as a standard unit for comparison. In the modern era, we know the distance of 1 AU (look it up!) in meters, so we could convert 4 light-years into meters and get that parallax angle to α-Centauri. But let's dig deeper into conversion factors.
The Sun is also 8 light-minutes away (8.32 to be more exact — but keep it to one digit precision for now). That is, it takes 8 minutes for light to get here from the Sun. So the parallax angle to α-Centauri should be 8 lm/4 ly. All we need to do now to figure this out is convert light-minutes to light-years. How many minutes in a year? Why not ask the cast of Rent?
θ = 8 lm/4 ly × 1 year/525,600 min = 4 × 10⁻⁶ radians
WOW! That parallax angle for α-Centauri is a very small number, even for radians. So how many degrees is that? Here is where the degrees system gets very odd. We can finely divide degrees in decimals, or we also think of degrees as being made up of arcminutes ("minutes of arc") and each arcminute is divisible into arcseconds. But rather than base 10 as the French Revolution would have us do (i.e., the metric system), it's base 60: there are 60 arcminutes in a degree and 60 arcseconds in an arcminute. This makes drawing an arcsecond nearly impossible since it's a ridiculously small angle: 1/3600th of a degree!
θ = 4 × 10⁻⁶ radians × 57.3o/radian × 3600"/1o = 0.8"
So the parallax angle of even the closest star is less than one arcsecond (which explains why Tycho Brahe could never measure the parallax of any stars without a telescope!).
But let's say you're an Astronomer in the late 19th century and your equipment is good enough to measure arcseconds. However, you don't know the distance to the Sun (8.32 lm or 1.5 × 10¹¹m, etc.). Then you might just decide to keep everything relative to 1 AU. If you measured your angle in radians, your distance would also be in AU since you would need your units to cancel in such a ratio:
p(radians) = 1 AU / D(AU)
Wouldn't this be sensible? However, the formula in your book looks (almost) like this:D (pc) = 1 AU / p(")
or, rearranged:p(") = 1 AU / D (pc)
That is, the relative distance to something which has a parallax angle measured in arcseconds (") is reported in "parallax arcseconds" or parsecs by taking 1 (AU) and dividing by the angle in arcseonds. Clearly this is a bizarre twisted set of units. But it does mean that even if we don't know any of these sizes or distances in meters, we can develop a conversion factor for AU and parsecs. Multiply both sides by the conversion factors for radians and arcseconds:
p(radians) × 57.3(o/radian) × 3600("/1o) = 1 AU / D(AU) × 57.3 × 3600
p(") = 206,000 AU / D(AU)
Comparing this to the formula above for p in arcseconds, you get
206,000 × D (pc) = D (AU)
i.e., there are 206,000 AU in a parsec. Since we're so clever and know that the Sun is both 1 AU and 8.32 lm away, we can now deduce how many light-years are in a parsec.
1 parsec = 206,000 AU × 8.32 lm/1 AU × 1 ly/525,600 lm = 3.26 ly
If this didn't immediately make sense (I'd be very surprised if it made sense the first time you read through it!), what you need to do is sketch out the incredibly thin triangle we're talking about. Also, if you don't know what a light-year is, it's the distance light travels in a year. Either that, or it's the same as a regular year, but with half the calories.
For those keeping score at home, the train wreck that occured on 9/6 was entirely due to multiplying one side of an equation by a conversion number and not the other. And it's proof none of us are immune from the perils of algebra. Slow and steady wins the race, and above all, avoid strings of equal signs.
Is this star close?
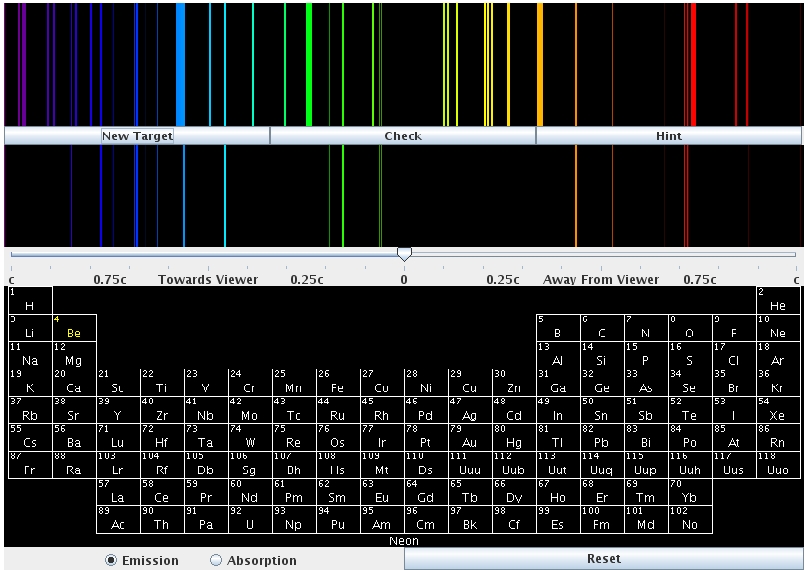
Fun with Spectroscopy!
Make your own spectrometer!
Spectroscopy! Here's a "game" to look at emission (or absorption) lines.
The Size of Things
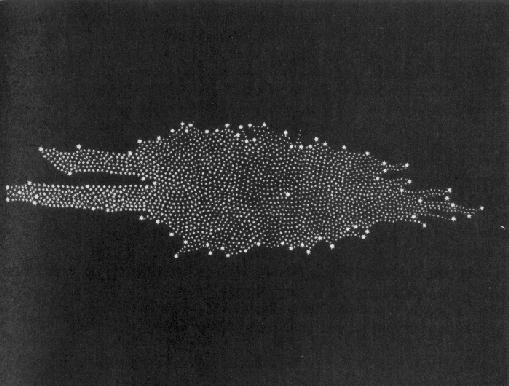
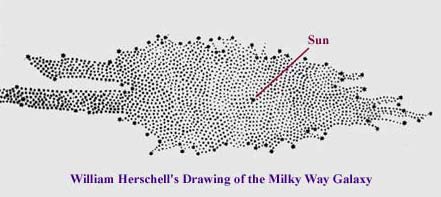
Recognizing we're not special has been a difficult sell throughout history. First we find out the Earth isn't the center of the Solar System (1500s), then we find out the Sun isn't the center of the galaxy (1800s), and finally we discover there are other galaxies so even the Milky Way isn't special (gasp!). This it the progression from the Copernican Principle to the Cosmological Principle. We're not actually there yet...but close.
For an overview of the Curtis-Shapely Great Debate, click on this link. The fourth link is Dr. Virginia Trimble's article.
Kepler
- On the far right, stolen brazenly from Mrs. Armes Chemistry and Physics (a NY high school class): an animation demonstrating Kepler's 2nd law. (To be fair, I'm nearly certain she got it from somewhere else.)
- Below, a plot showing how eccentric an ellipse needs to be before you notice (click to enlarge). The colored dots at each (progressively more eccentric) focus reflect eccentricities on the table below. Note that the colors of the corresponding ellipses matches. Note also that the focal points are simply e away from the center since a = 1 here. All the planets orbital eccentricities lie between e= 0 and 0.1 except Mercury (0.2). Note that the only way you can even tell that 0.2 looks like an ellipse is that the Sun (dot) is offcenter!
eccentricity, e color 0.0 red 0.1 green 0.2 blue 0.3 cyan 0.4 pink 0.5 yellow 0.6 red 0.7 green 0.8 blue 0.9 cyan 0.99 pink 0.999 yellow 
Click to enlarge.
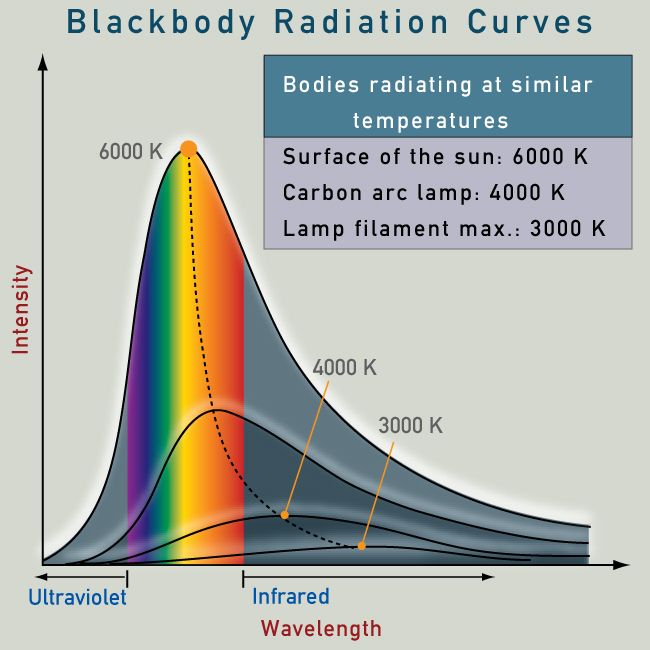
Blue is hot, red is cold?
Blackbody radiation confuses lots of people. You're not alone. Check out:
- http://phet.colorado.edu/simulations/sims.php?sim=Blackbody_Spectrum
- http://webphysics.davidson.edu/Applets/BlackBody/BlackBody.html
- this is maybe a better app to play with; slide up and
down the temperature scale: at ~5000 K, you've got the Sun.
For the advanced student who wants to know why this is all so:
- Quantum reasoning for Blackbody curve
Click on the image to get a closer look.
Monsters of the Id (or of the Milky Way)
At the center of our galaxy is a massive black hole; this was proven when the entire orbit of S0-2 was mapped over a 16 year period. Now, with the discovery of S0-102 (11.5 year period), we can do tests of GR using this massive black hole at the center of our galaxy.
If the orbit is 0.2" across (let's say the semimajor axis is ~0.1") and the galaxy center is 8000 pc or so away, how big is the orbit in AU? Hint: if 1" subtends 1 AU at 1 pc, then it also subtends 8000 AU at 8000 pc. Similarly, .1" subtends 1 AU at 10 pc or 800 AU at 8000 pc. The orbit is only about 20 times the size of the Solar System!!!
Hey, that means we can calculate what the mass of the black hole must be (approximately). P2=a3 for P in years and a in years ONLY if you use the Sun. Otherwise, it's
M = a3 (4 π2)/(G P2)
Ah, but normally "G" is given in kg, m, s type units as: 6.67×10⁻¹¹ m3 / (kg s2) and we have P in years and a in AU, and we probably prefer the mass in M⊙...what's a student to do?! Most students would dutifully convert: 1 M⊙=2×1030 kg; 1 year = π×107 s; and 1 AU = 1.5×10¹¹ m. But here's a funny thing. The mass should scale as a3 over P2. That is, since AU and years give a proportionality constant of 1 if you use one solar mass:
M = a3 /P2
So as long as you measure a in AU and P in years, your answer will be in solar masses!!! Left as an exercise for the student: 11.5 year period and an 800 AU semimajor axis should give you (one digit precision here) a 4 million M⊙ black hole... Wow! This matches the value given in various references.
Later, we'll talk about the "Schwarzschild radius" of a black hole; effectively the event horizon.
rSch = 2 GM/c2
which, for a 4 million solar mass black hole is about...well (said, Dr. Peel with a smirk), notice that the only variables state that the radius scales as the mass. So the 2G/c2 is just baggage. If the Sun (1 M⊙) has an rSch of 3 km, then a 4×10⁶ M⊙ black hole must have rSch= 12×106 km... about a fifth of the size of the orbit of Mercury?!
- See this video for context and a glimpse of some upcoming exciting astronomy!
- Or this overproduced video with some of the same footage (pirates!?).
- See this corny video for a straightforward explanation.
- Visit this UCLA website for more information.
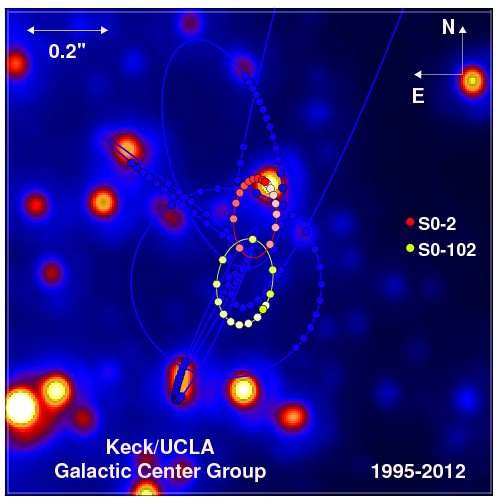
Click on the image to get a closer look.
Relativity!
Cool relativity game concept! ToH: Steven Rausch
Λ
Here's a nice, simple article on the history of Λ and the dangers of bias (in this case, believing the universe had to be static).
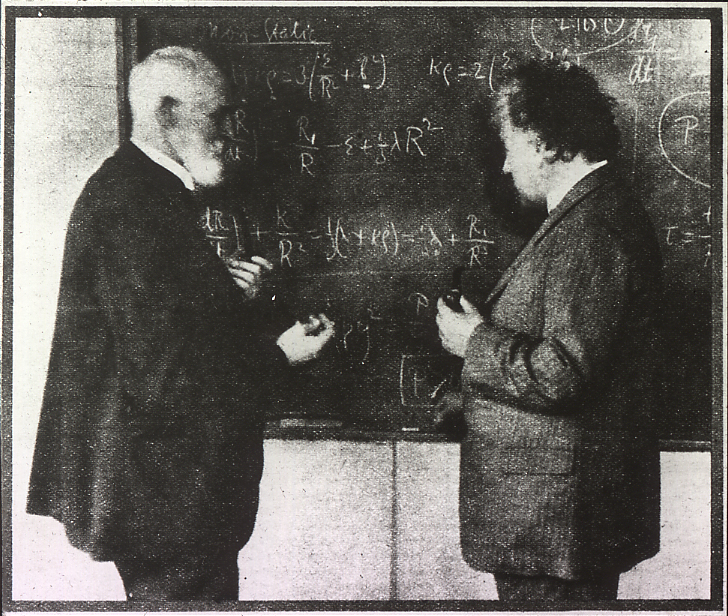
Einstein and Willem deSitter playing with the Universe
Errata
I should come clean with you all: we are prone in non-technical (and sometimes technical) classes to make some interesting claims regarding black holes and the historical record. In the mocking words of a journalist friend of mine, "Some stories are too good to check." However, a little explanation is warranted about the claim that Pierre-Simon Laplace (and independently, John Michell) predicted black holes in 1783.
Operating under the idea that light was made of corpuscles (Newton even thought so), there was no reason for Laplace and friends to suspect light was massless - momentum was imparted by light. What these (very smart) folks did was calculate how massive an object (such as a massive star) needed to be so that the escape velocity was the same speed as the speed of light. This is not a black hole, but an object from which light could barely escape...to infinity! So, no, it wouldn't be black. Or even darkish.
Of interest then, is that the Schwarzschild radius makes an appearance in Laplace's work, but he was still working with absolute time and no speed limits, so space isn't "weird" or distorted. Any decent physicist might still have guessed that a term like GM/c2 would have shown up since this is a length via unit analysis...she might even guess 2GM/c2 since escape velocities in Newtonian physics look like that!
For an interesting article outlining the issue, click here.
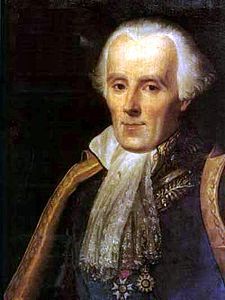
«Je suis très intelligent, mais peutêtre je ne suis pas un Einstein.»
 Back to
main class description webpage
Back to
main class description webpage