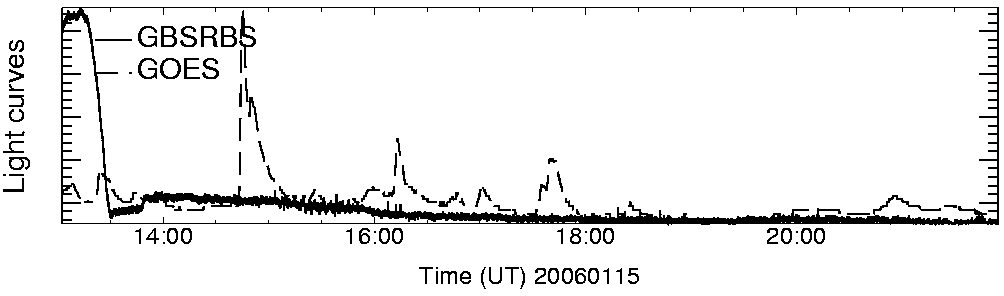
Green Bank Solar Radio Burst Spectrometer
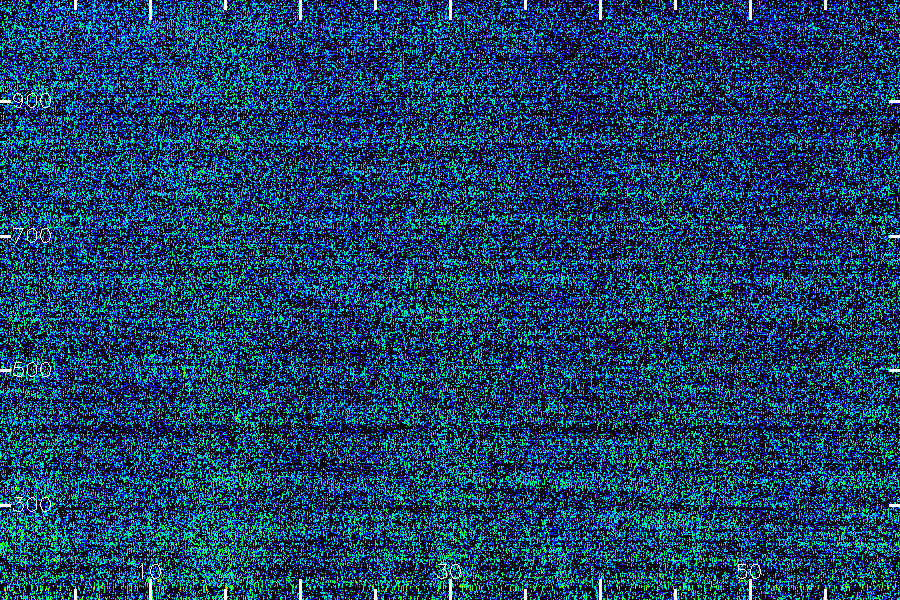
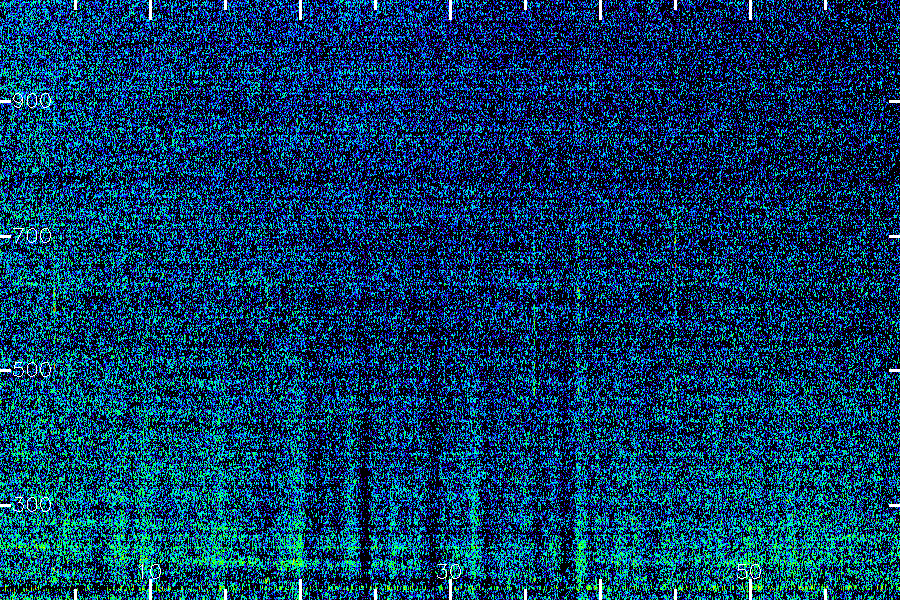
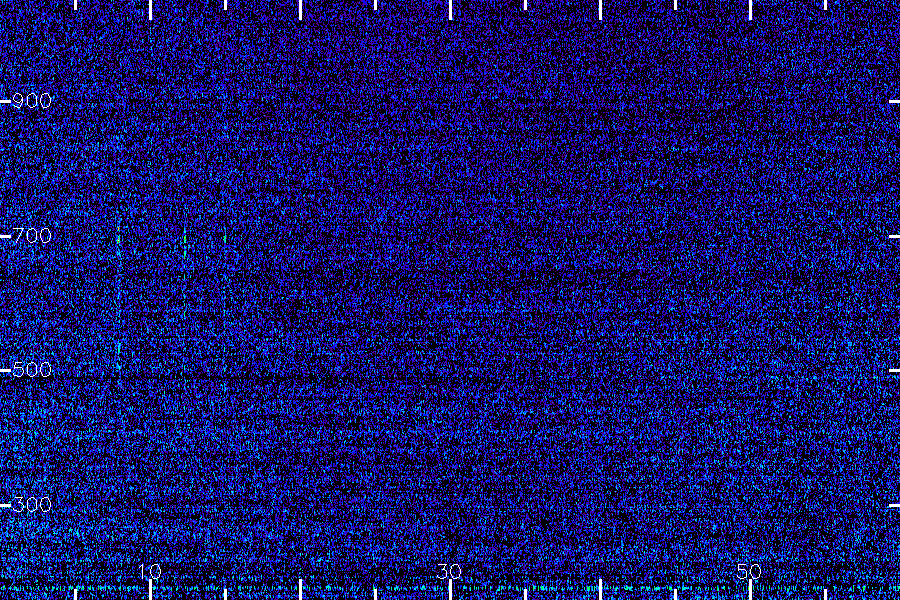
Background-Subtracted High Frequency Hourly Dynamic Spectra: 2006 01 15
The two polarizations are plotted separately, polarization 1 on top.
Presently these are linear polarizations.
The frequency range is more restricted than in the plots of raw data: it
is 160 (bottom) to 1000 MHz (top of each panel).
Vertical ticks every 10 minutes, horizontal ticks at 300, 500, 700, 900
MHz.
Vertical white lines (dotted lines on light curve) indicate local sunrise and sunset (to within 2
minutes).
Click on a panel to see a larger image (4 second resolution).
| 11-12 UT | 12-13 UT | 13-14 UT | 14-15 UT |
| 15-16 UT | 16-17 UT | 17-18 UT | 18-19 UT |
| 19-20 UT | 20-21 UT | 21-22 UT | 22-23 UT |