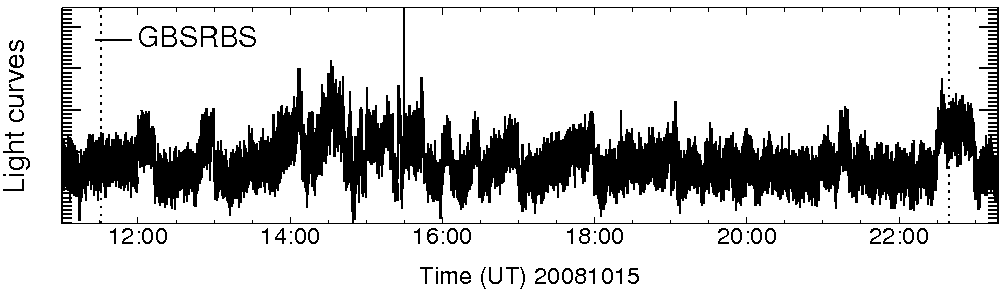
Green Bank Solar Radio Burst Spectrometer
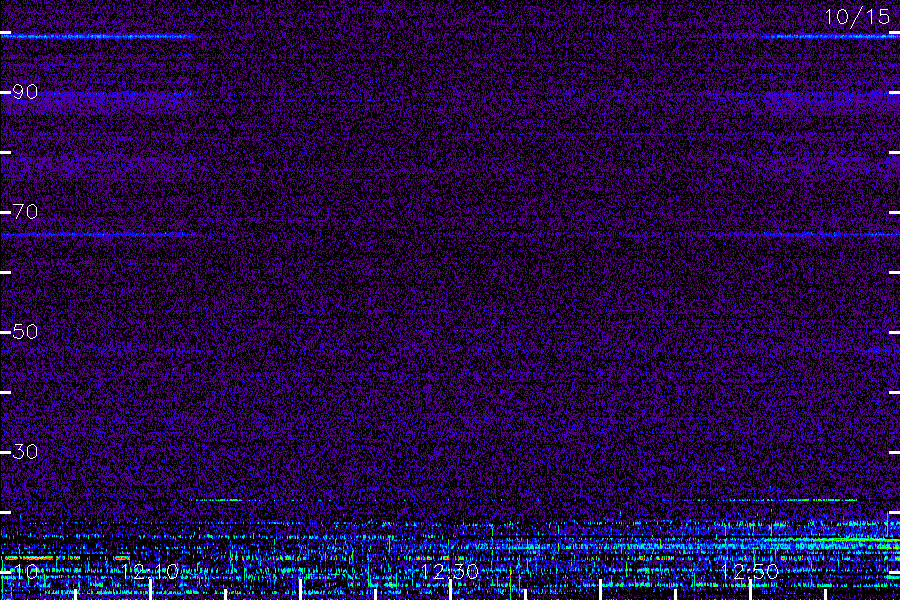
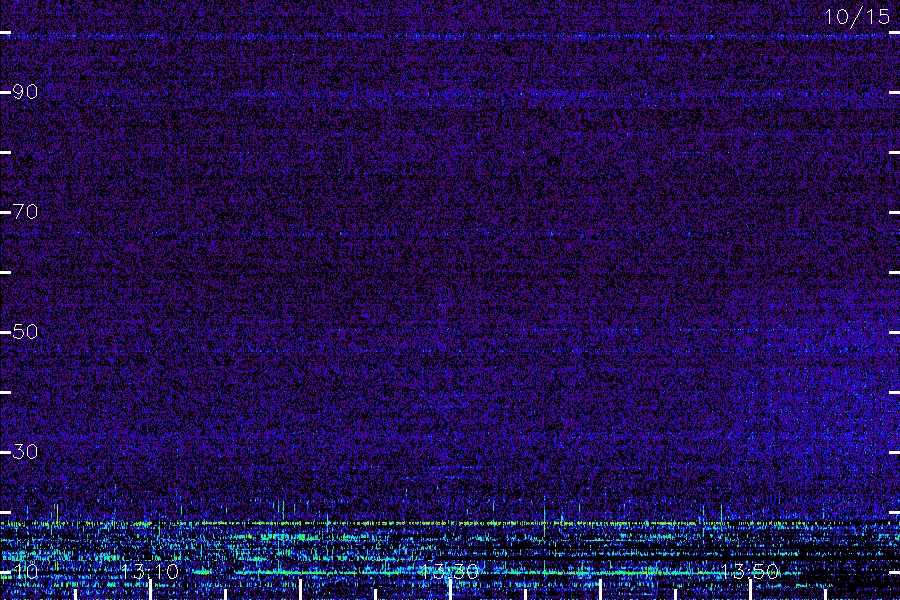
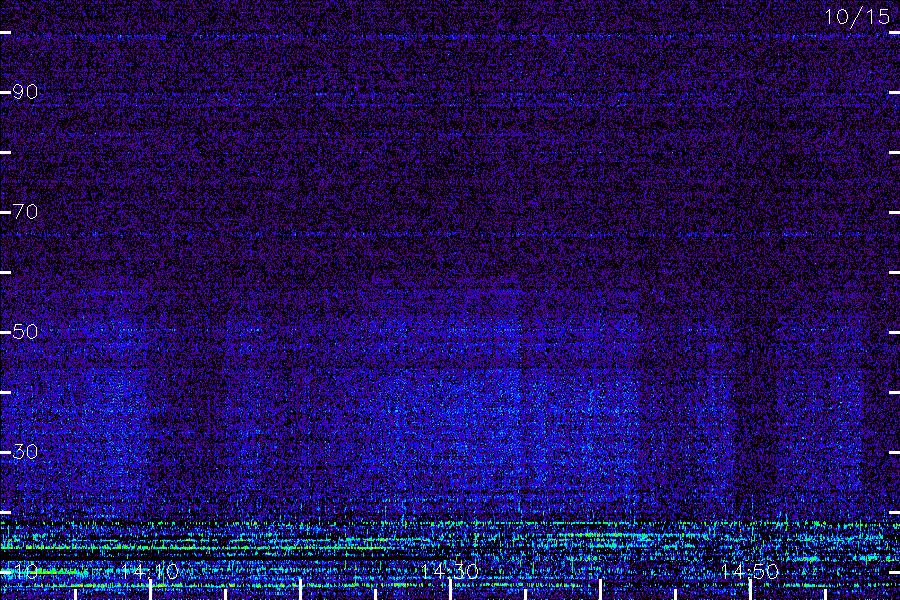
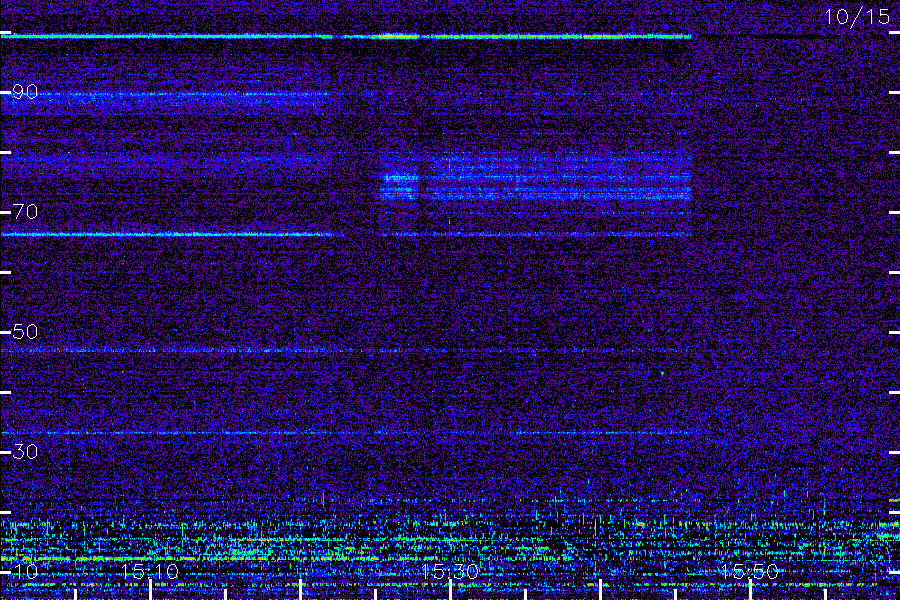
Background-Subtracted Hourly Dynamic Spectra: 2008 10 15
The frequency range is typically 18 (bottom) to almost 70 MHz (top of each panel).
These data have had narrowband interference as well as background
subtraction performed, so the galactic
background at low frequencies is no longer present but residuals of
the broad band of interference at 20-24 MHz are usually prominent.
Artefacts may include lightning (shows up as finite--width vertical
lines)
and broadband TV signals around 50 MHz reflected from sporadic E-layer
ionization in the ionosphere (Green Bank is the best/worst place in
North America for this phenomenon).
Vertical white lines (dotted lines on light curve) indicate local sunrise and sunset
(to within 2 minutes).
Click on a panel to see a larger image (4 second resolution).
| 10-11 UT | 11-12 UT | 12-13 UT | 13-14 UT |
| 14-15 UT | 15-16 UT | 16-17 UT | 17-18 UT |
| 18-19 UT | 19-20 UT | 20-21 UT | 21-22 UT |