| Name | Last modified | Size | Description | |
|---|---|---|---|---|
| Parent Directory | - | |||
| resources/ | 2021-11-24 00:17 | - | ||
| rsr.33551.blanking.sum.admit/ | 2022-02-03 21:02 | - | ||
| rsr.33551.driver.sum.admit/ | 2022-02-03 21:02 | - | ||
| rsr.obsnum | 2022-02-03 21:01 | 6 | ||
| rsr.33551.blanking.sum.txt.apar | 2022-02-03 21:02 | 13 | ||
| rsr.33551.driver.sum.txt.apar | 2022-02-03 21:02 | 13 | ||
| lmtoy.rc | 2022-02-03 21:01 | 26 | ||
| date.log | 2022-02-03 21:01 | 29 | ||
| rsr.33551.rfile | 2022-02-03 21:01 | 230 | ||
| casa-20220204-020217.log | 2022-02-03 21:02 | 345 | ||
| casa-20220204-020230.log | 2022-02-03 21:02 | 345 | ||
| lmtoy_33551.rc | 2022-02-03 21:01 | 376 | ||
| rsr.33551.badlags | 2022-02-03 21:02 | 495 | ||
| rsr.33551.blanking | 2022-02-03 21:01 | 613 | ||
| rsr.spectra.svg.html | 2022-02-03 21:02 | 945 | ||
| lmtoy_33551.log | 2022-02-03 21:02 | 2.4K | ||
| tar.log | 2022-02-03 21:02 | 5.7K | ||
| rsr_badlags.log | 2022-02-03 21:02 | 9.0K | ||
| rsr.33551.driver.sum.txt.rms.ps | 2022-02-03 21:02 | 9.5K | ||
| rsr_tsys.log | 2022-02-03 21:02 | 9.9K | ||
| rsr.33551.blanking.sum.txt.rms.ps | 2022-02-03 21:02 | 12K | ||
| rsr.33551.driver.sum.txt.log | 2022-02-03 21:02 | 18K | ||
| rsr.33551.blanking.sum.txt.log | 2022-02-03 21:02 | 18K | ||
| rsr.spectra_co.png | 2022-02-03 21:02 | 25K | ||
| rsr_driver0.log | 2022-02-03 21:02 | 26K | ||
| rsr_driver.log | 2022-02-03 21:02 | 30K | ||
| rsr.spectra.png | 2022-02-03 21:02 | 33K | ||
| rsr_sum.log | 2022-02-03 21:02 | 34K | ||
| rsr.33551.driver.sum.txt.sp.ps | 2022-02-03 21:02 | 36K | ||
| rsr.33551.blanking.sum.txt.sp.ps | 2022-02-03 21:02 | 37K | ||
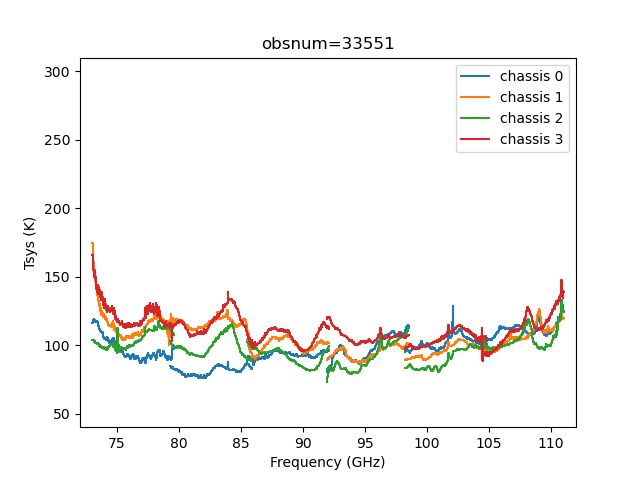
| rsr.tsys.png | 2022-02-03 21:02 | 43K | ||
| rsr.wf-0.png | 2022-02-03 21:02 | 57K | ||
| rsr.wf-2.png | 2022-02-03 21:02 | 57K | ||
| rsr.wf-3.png | 2022-02-03 21:02 | 58K | ||
| rsr.wf-1.png | 2022-02-03 21:02 | 58K | ||
| rsr.33551.blanking.sum.txt | 2022-02-03 21:02 | 64K | ||
| rsr.33551.driver.sum_bandspec.txt | 2022-02-03 21:02 | 77K | ||
| rsr.33551.driver.sum.txt | 2022-02-03 21:02 | 95K | ||
| badlags.png | 2022-02-03 21:02 | 108K | ||
| rsr.spectra.svg | 2022-02-03 21:02 | 152K | ||
| rsr.wf0.pdf | 2022-02-03 21:02 | 253K | ||
| rsr.wf.pdf | 2022-02-03 21:02 | 257K | ||
| Source | I10565 |
|---|---|
| RA | 10:59:18.1 |
| DEC | 24:32:34 |
| Input Observations | 33551_0,33551_1,33551_2,33551_3, |
| Integration Time (s) | 304.44 |
| 220 GHz Opacity | 0.18 |
| Date of Reduction | 2022-Feb-03 |
See below for notes on the Redshift Search Receiver (RSR)
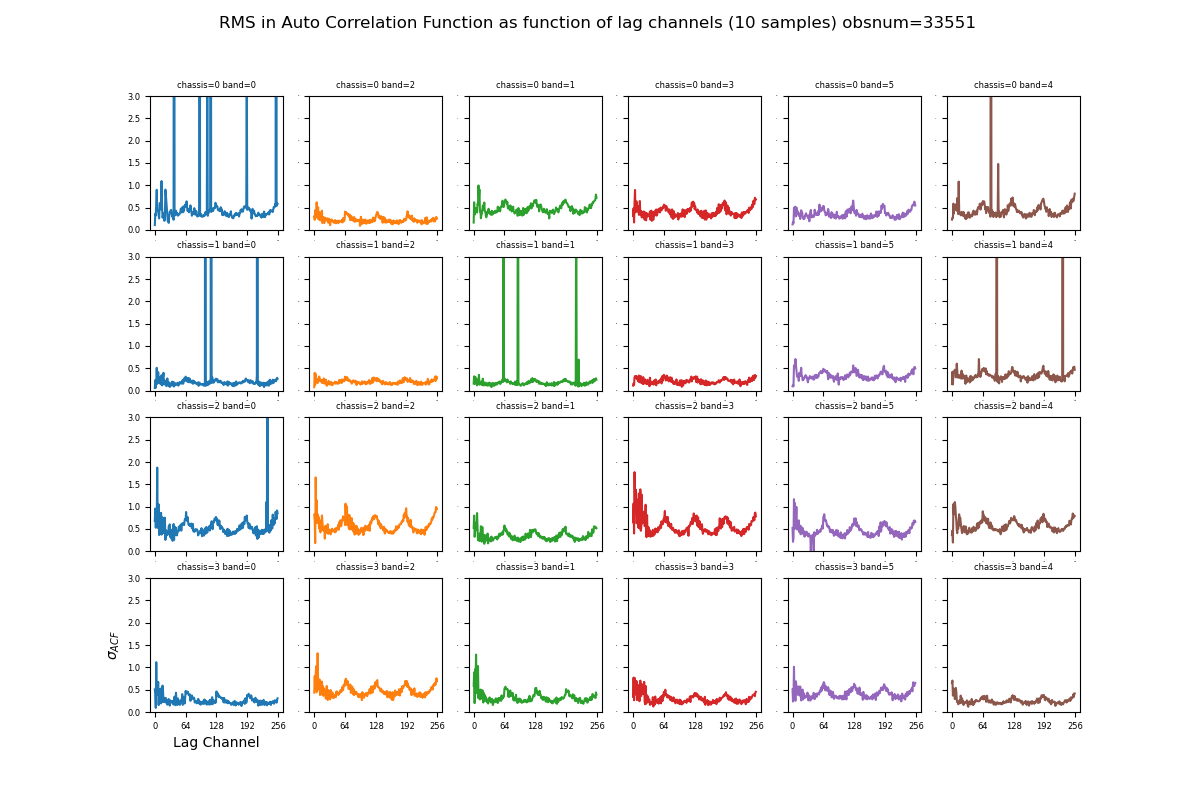
The Bad Lags plot shows a time sample based autocorrelation function (ACF) RMS for each channel, board and chassis (i.e., lag consistency). When the RMS is above a clip level (shown as max in the plot), this lag channel will be flagged. Boards are color coded by their board number (notice band order is 0,2,1,3,5,4)
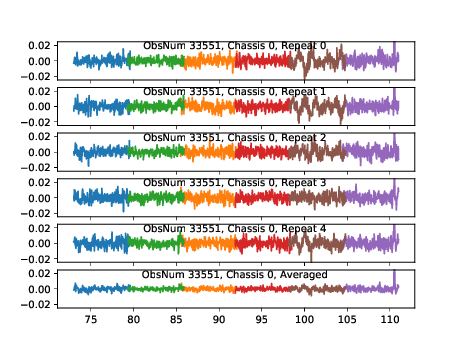
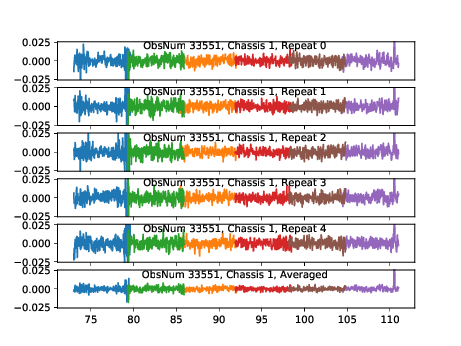
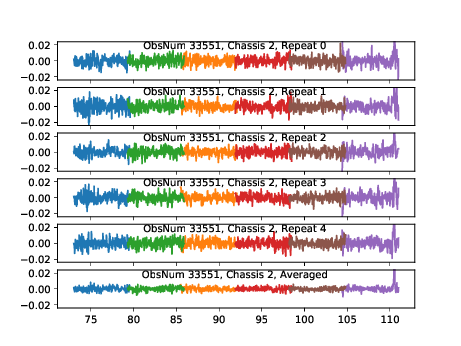
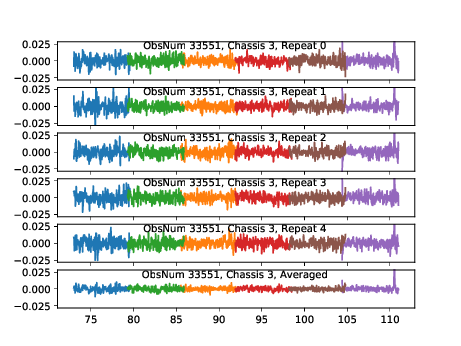
The Waterfall Plot is a spectrum for each band, chassis and time sample, color coded by their band. We keep two versions: the original one with minimal flagging and one that has the latest flags applied after the pipeline has been re-run. This plot is produced by rsr_driver (Author: D. Sanchez)
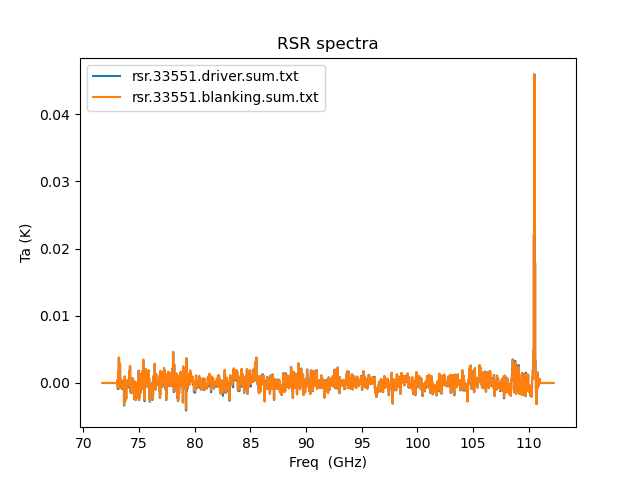
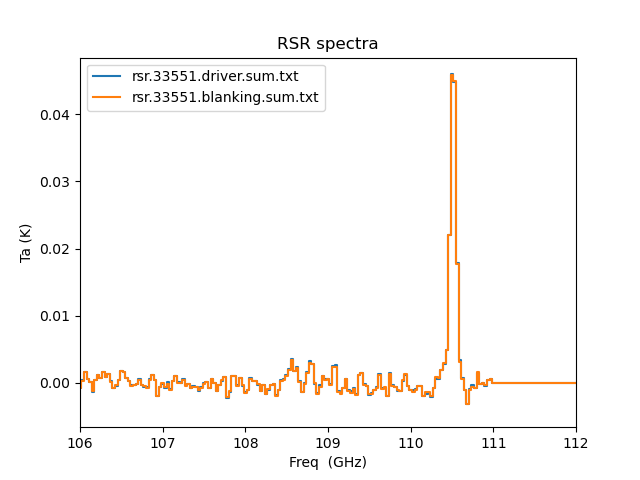
The rsr_sum version of the average spectrum has optional blanking and sections to avoid for baseline fitting. Below are the spectra from rsr_sum (orange) and rsr_driver (blue). If there is a significant difference between the two, then there is some subtle difference in how the scripts work.
Statistics on individual spectra
| rsr.33551.driver.sum.txt | rms=0.951 mK |
| rsr.33551.blanking.sum.txt | rms=0.950 mK |
| Expected noise for Tsys=100 K | rms=0.503 mK |