SL Pipeline summary for 2018S1SEQUOIACommissioning/79448 for IRC+10216
restfreq=115.271204
The figures in the right column are those generated from the first
pass of the pipeline, those on the left are the latest iteration.
If no figure shown, the pipeline did not produce it,
e.g. a combination obsnums will not have figures 1..7
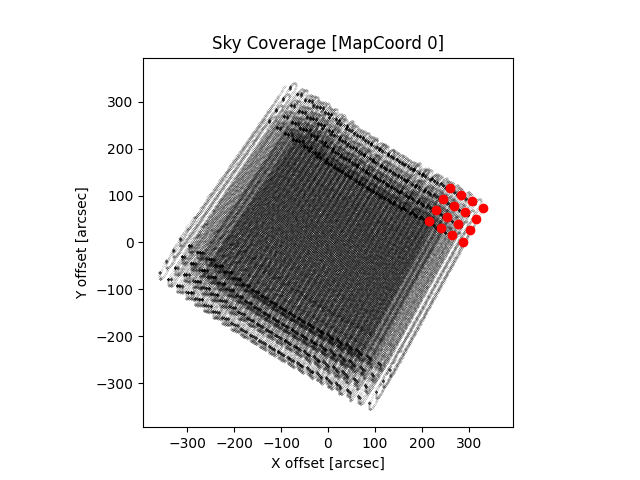
- Sky coverage for all 16 beams
(sky coordinates in arcsec w.r.t. map center)
- first integration beam imprint in red

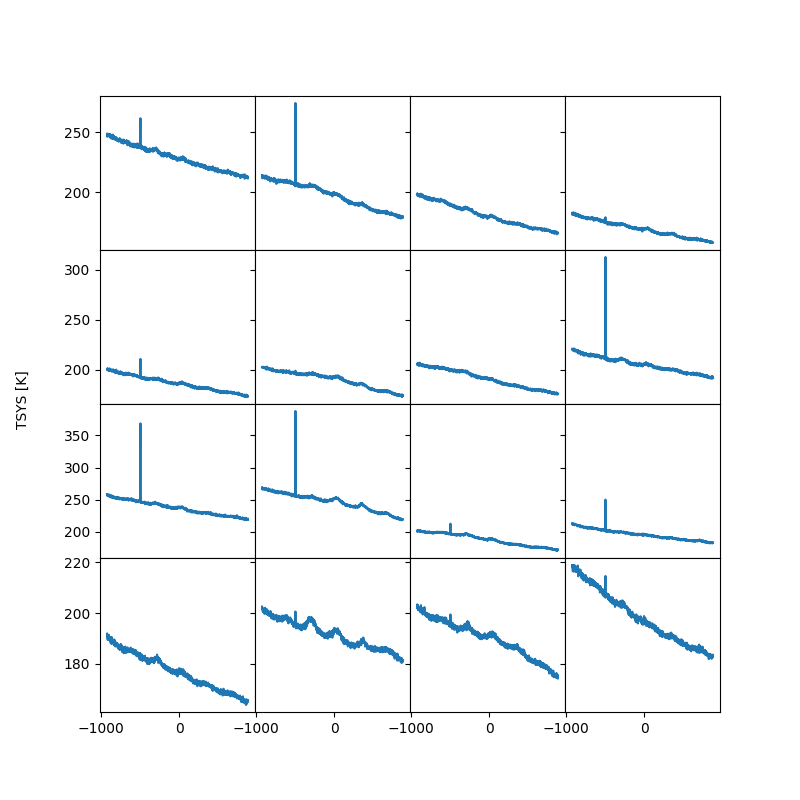
- Tsys for each beam in 4x4 panels
(VLSR [km/s] vs. TA* [K])
-- reasonable values are 50 .. 300 K

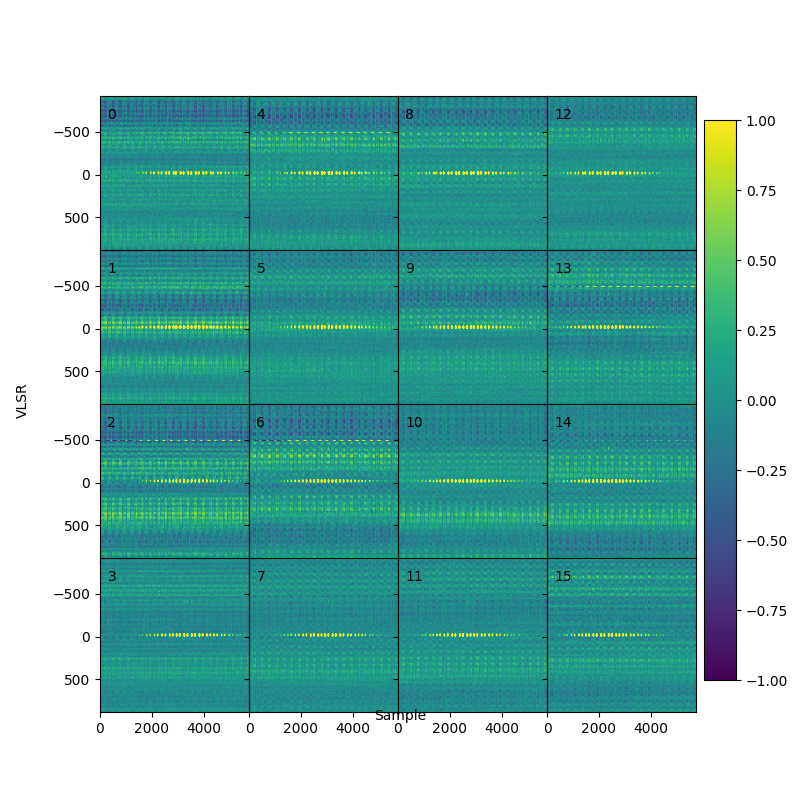
- Waterfall plot for each beam in 4x4 panels
(VLSR vs. SAMPLE TIME)

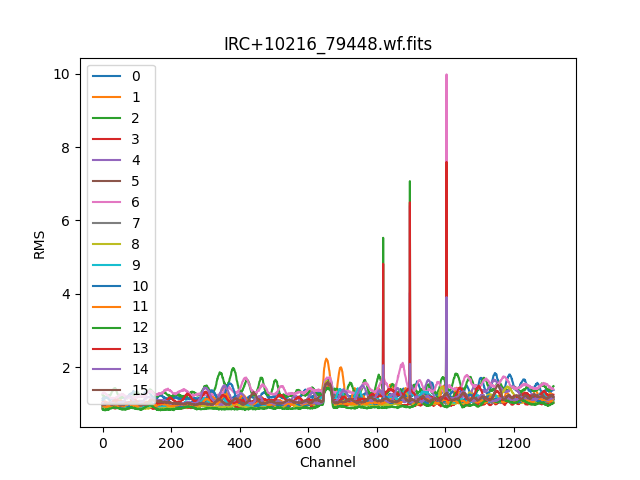
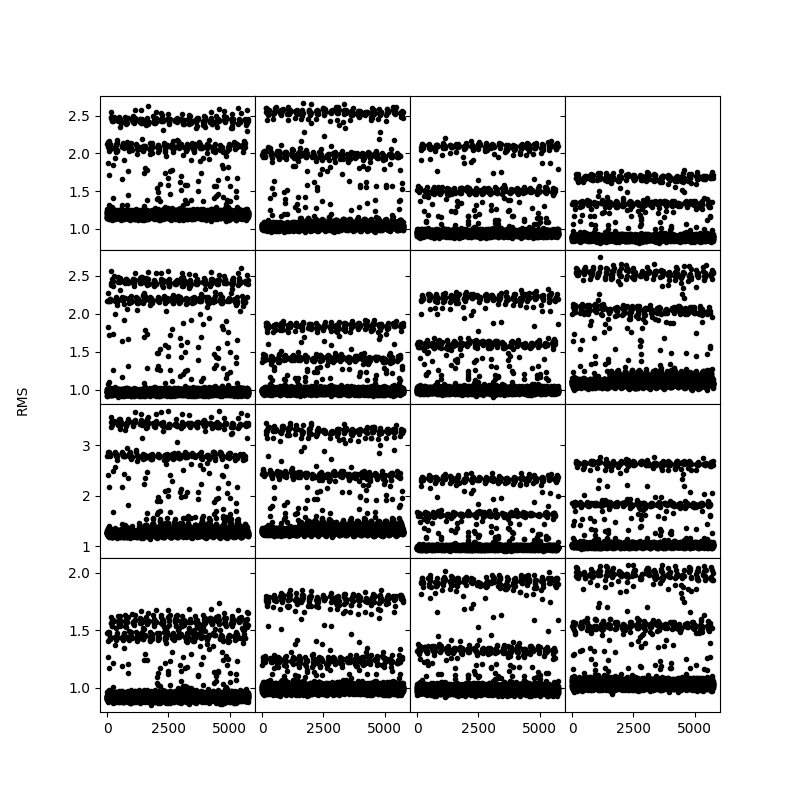
Waterfall RMS [K] as function of channel number
(RMS [K] vs. CHANNEL)
- this is where birdies show up best, or check *bstats*

- RMS [K] residuals from a 0-order baseline fit
as function of sample time
Each beam should give roughly the same RMS.

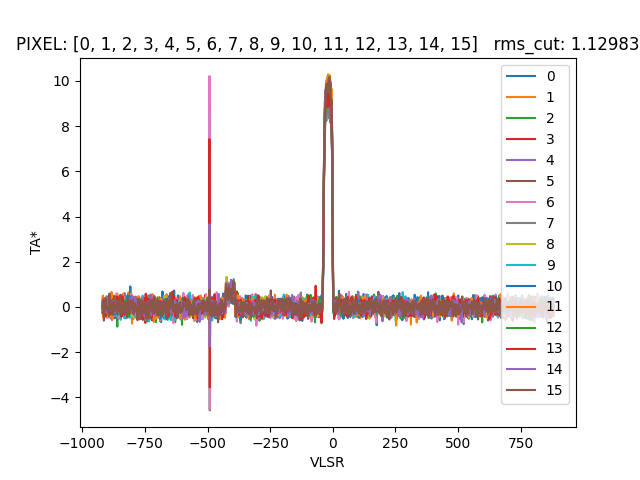
- Spectra for the whole map, overplotted for each beam
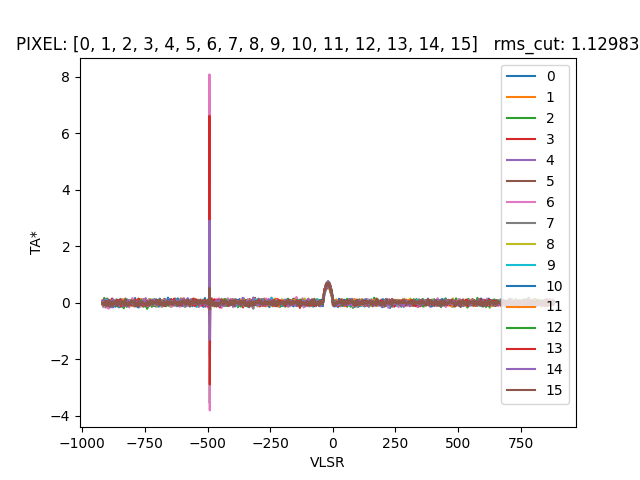

- Spectra for center beam, overplotted for each beam

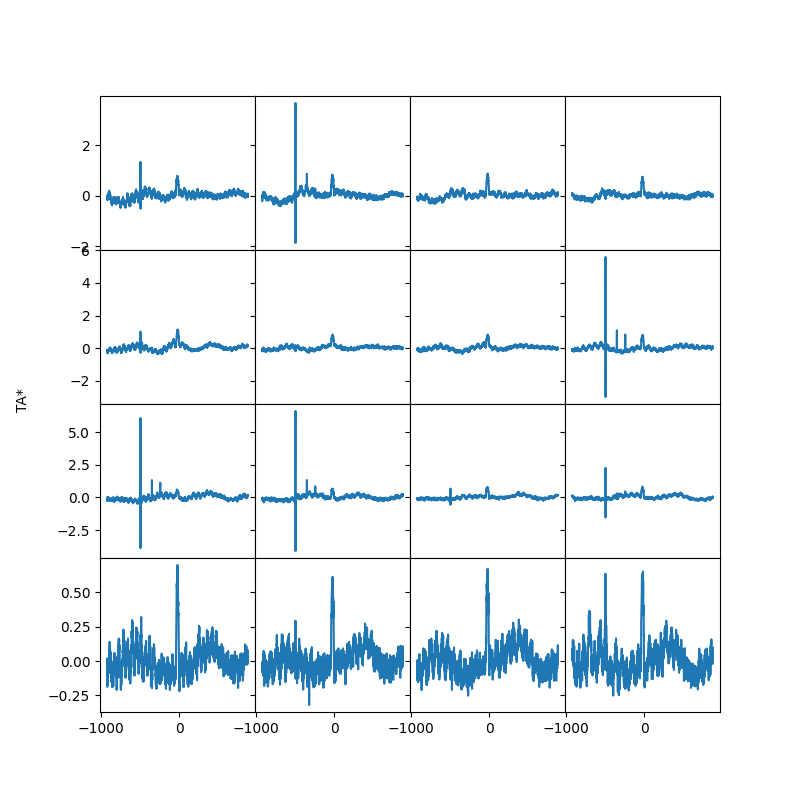
- mean_spectra_plot for each beam.
Unless there is strong signal, each spectrum should look
the same kind of noisy with zero baseline

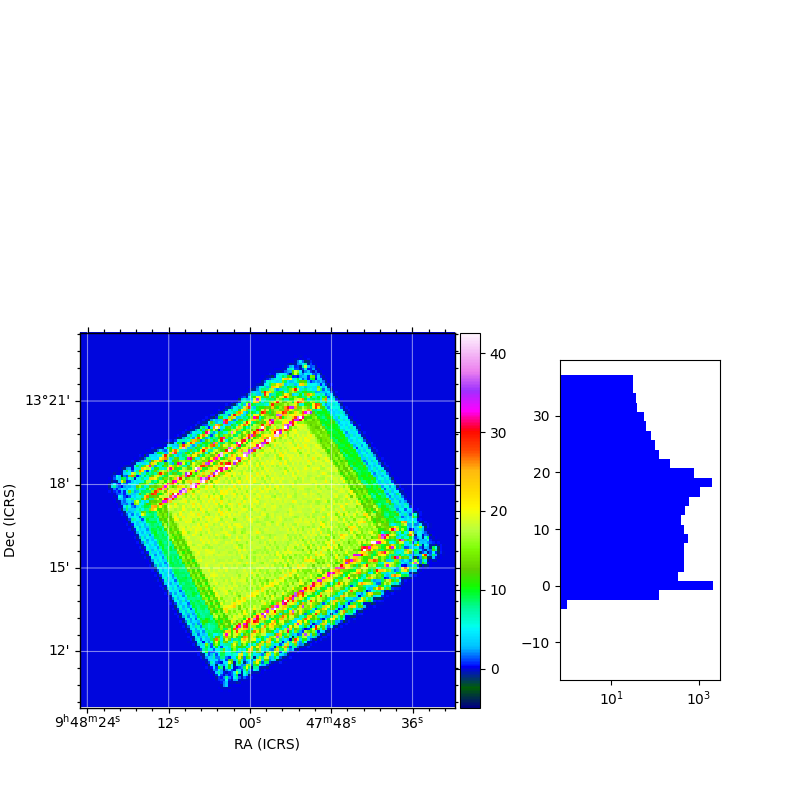
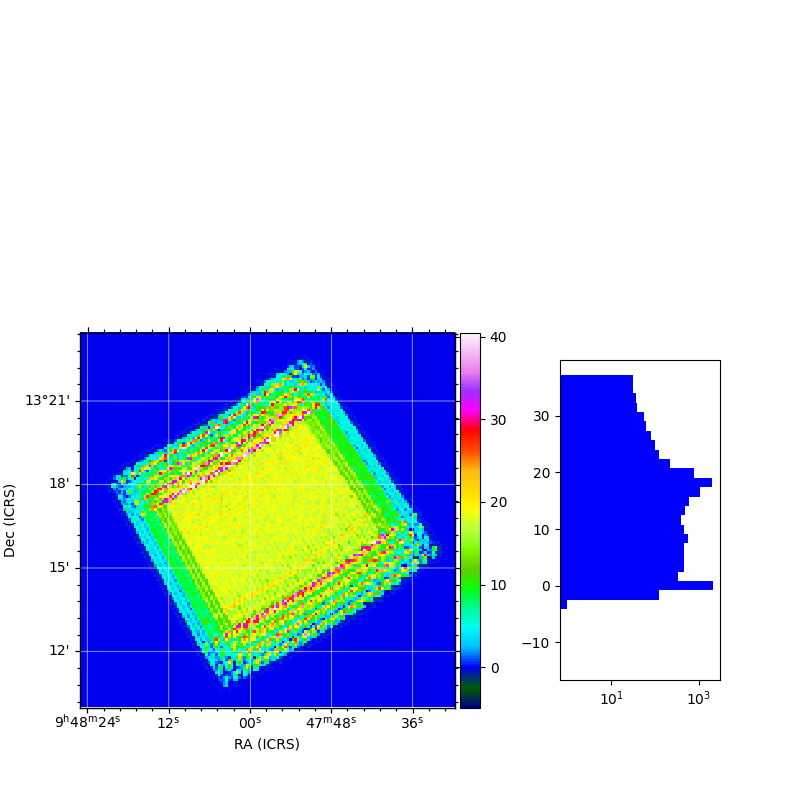
- Sky coverage + histogram as defined how often sky pixel was seen
(sky pixels are about half of LMT beam size)
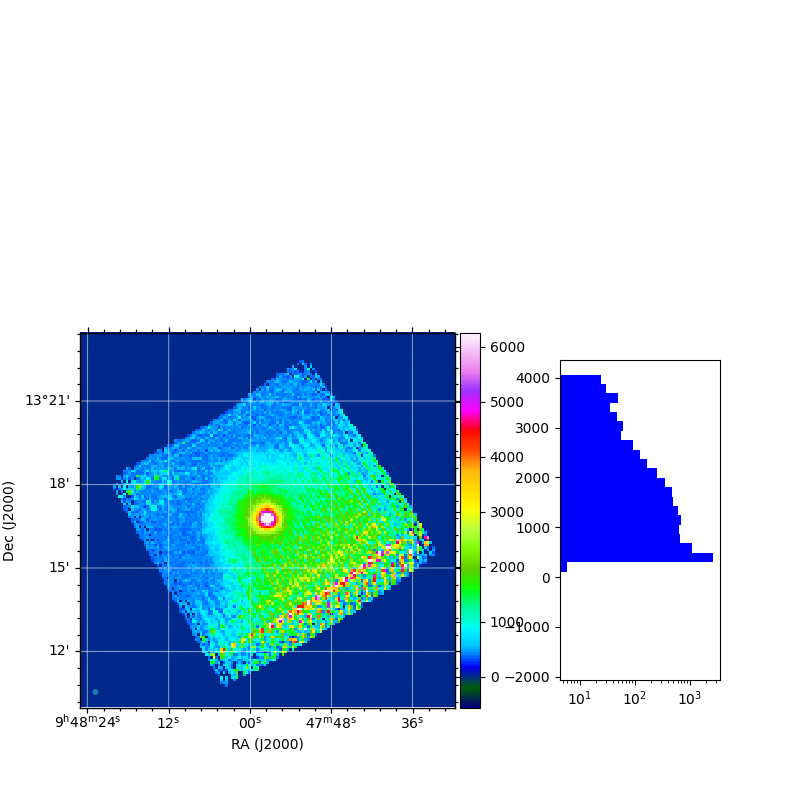
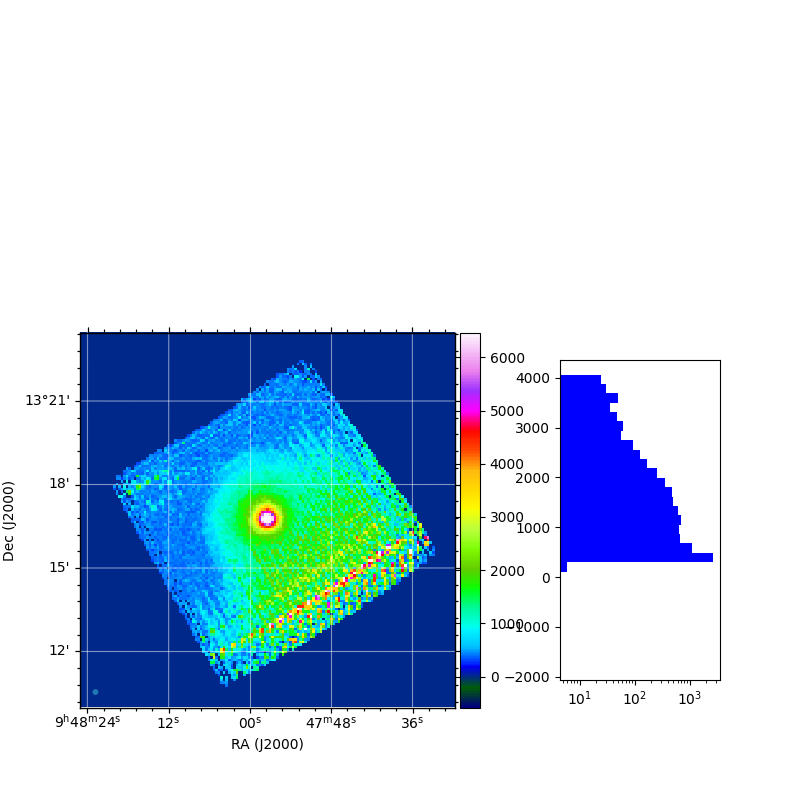
- Moment-0 estimate [K.m/s] (ADMIT)
plus histogram.

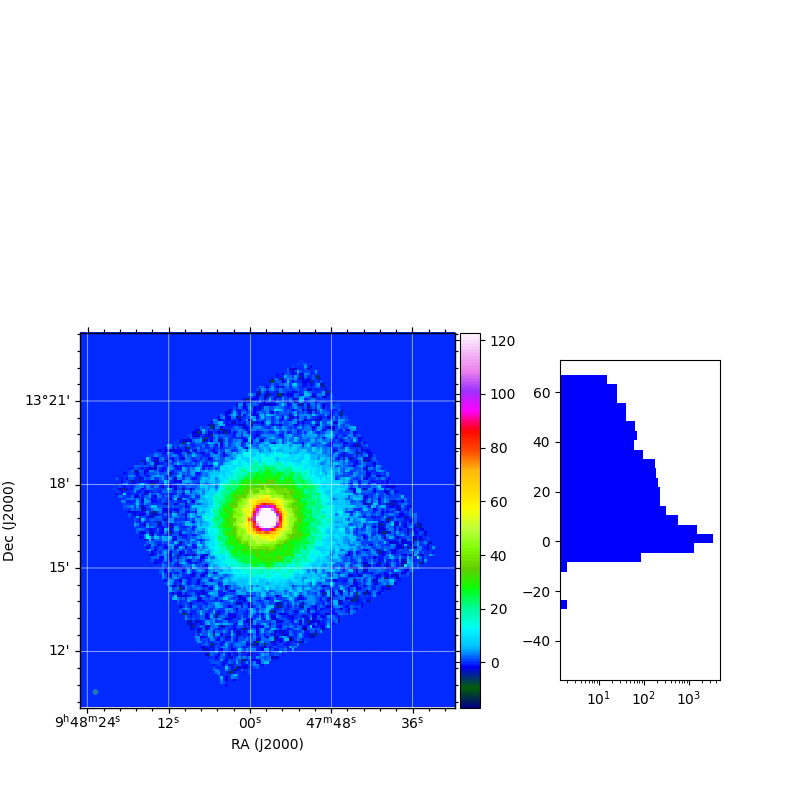
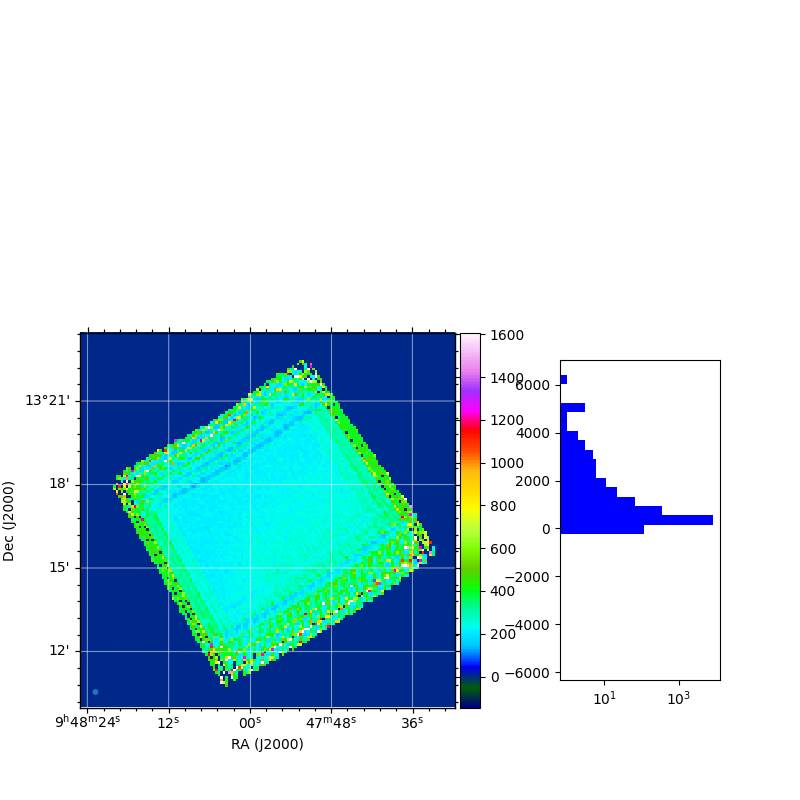
- Peak temperature [mK]
plus histogram.
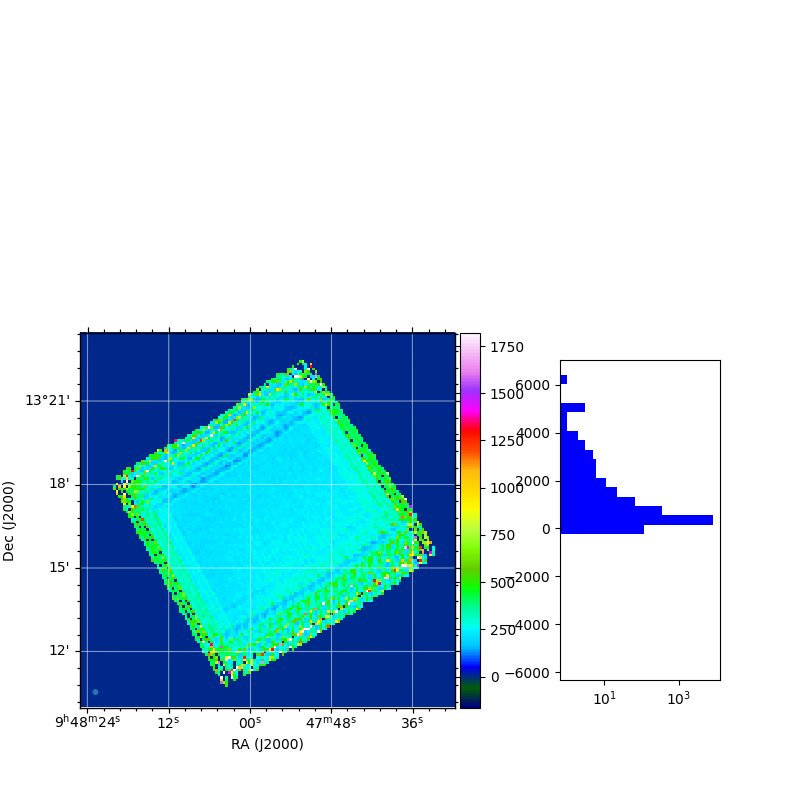
- RMS estimate [mK] (central value: 220.483 mK)
plus histogram.
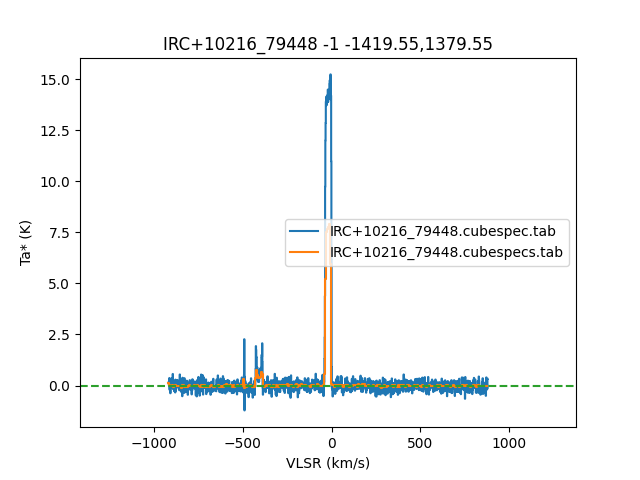
- Spectral coverage of raw and extracted
Last updated Wed Jul 12 12:51:29 EDT 2023 on DL5420