SL Pipeline summary for 2022S1SEQUOIACommissioning/95125 for IRC+10216
The figures in the right column are those generated from the first
pass of the pipeline, those on the left are the latest iteration.
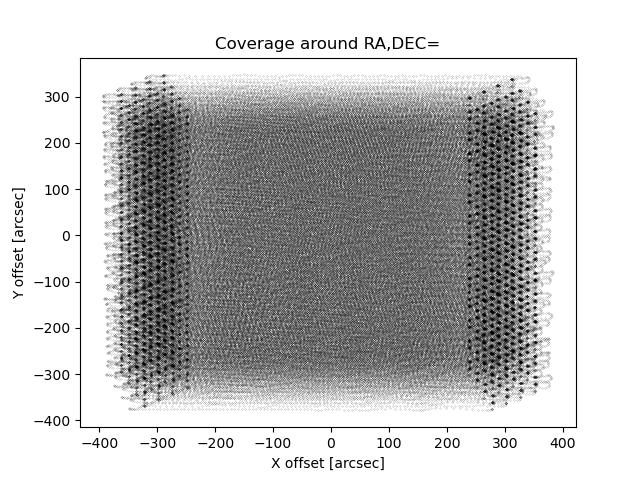
- sky coverage for all 16 beams
(sky coordinates in arcsec w.r.t. map center)

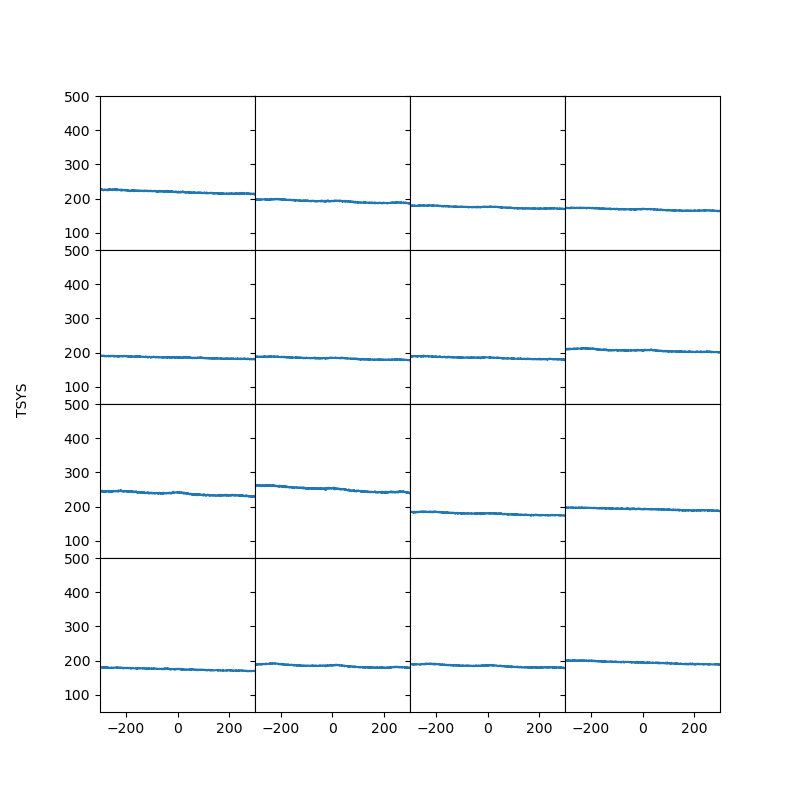
- Tsys for each beam in 4x4 panels
(VLSR vs. TA*)

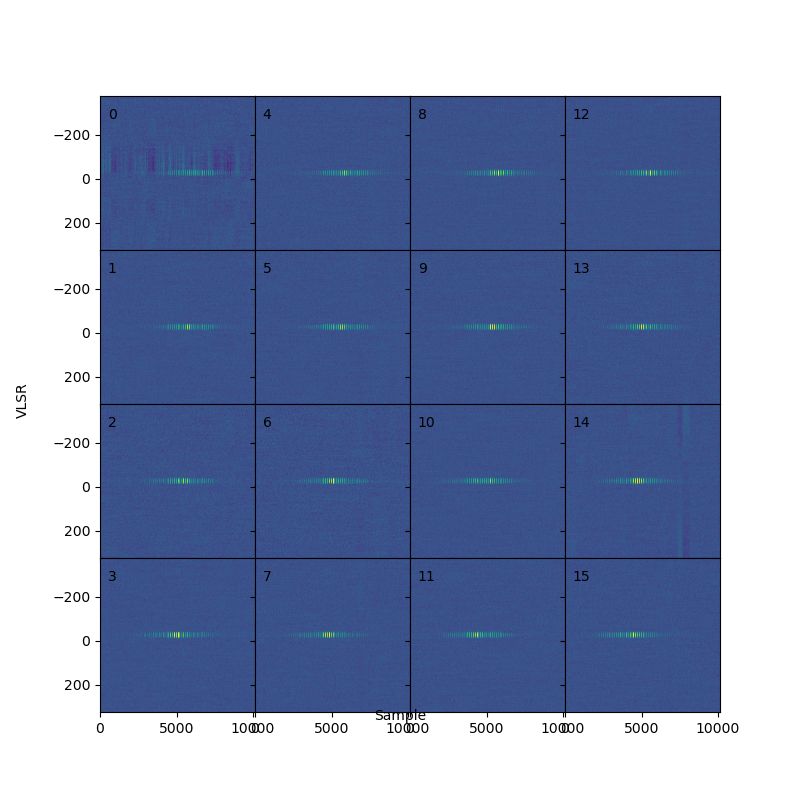
- waterfall plot for each beam in 4x4 panels
(VLSR vs. SAMPLE TIME)

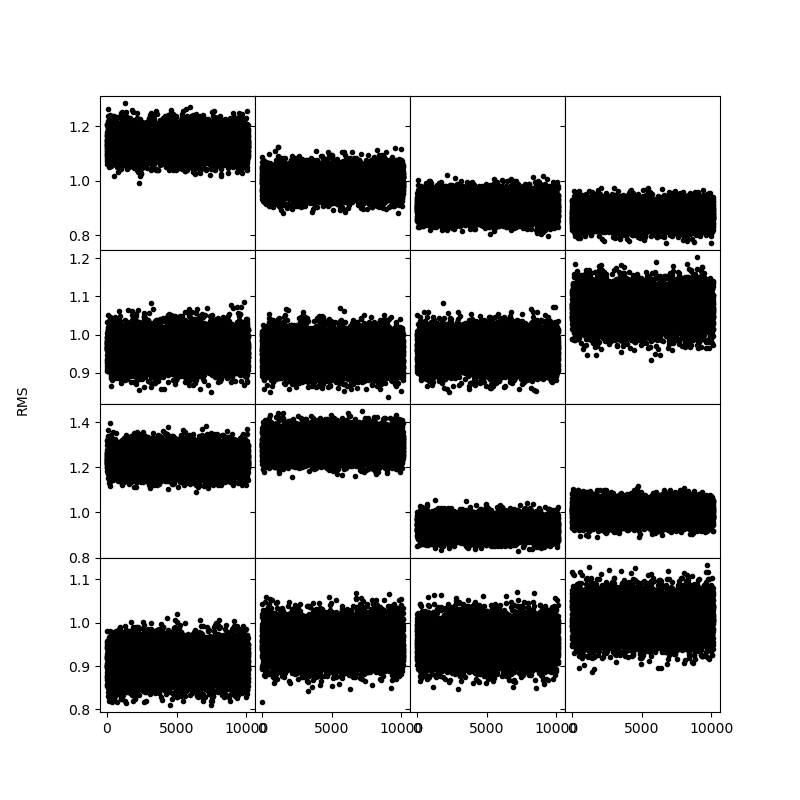
- RMS 0 order baseline fit for each beam in 4x4 panels

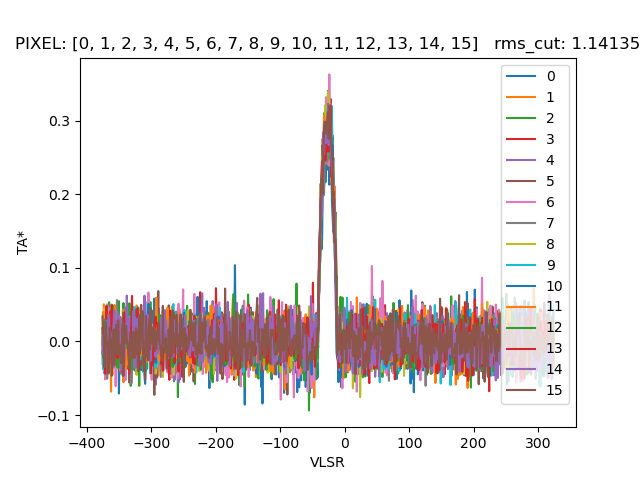
- spectra for the whole map, overplotted for each beam

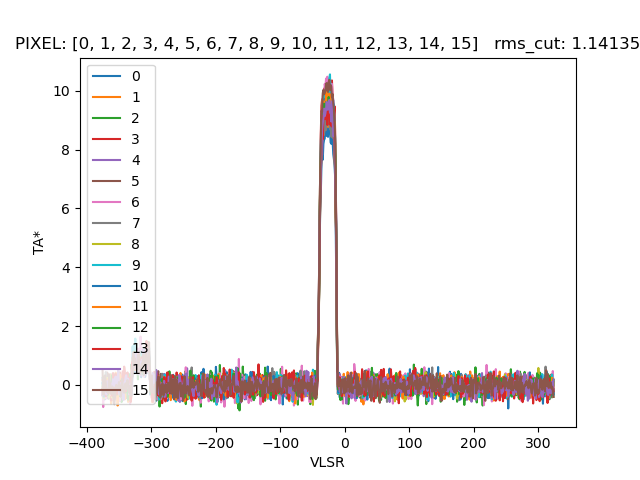
- spectra for center beam, overplotted for each beam

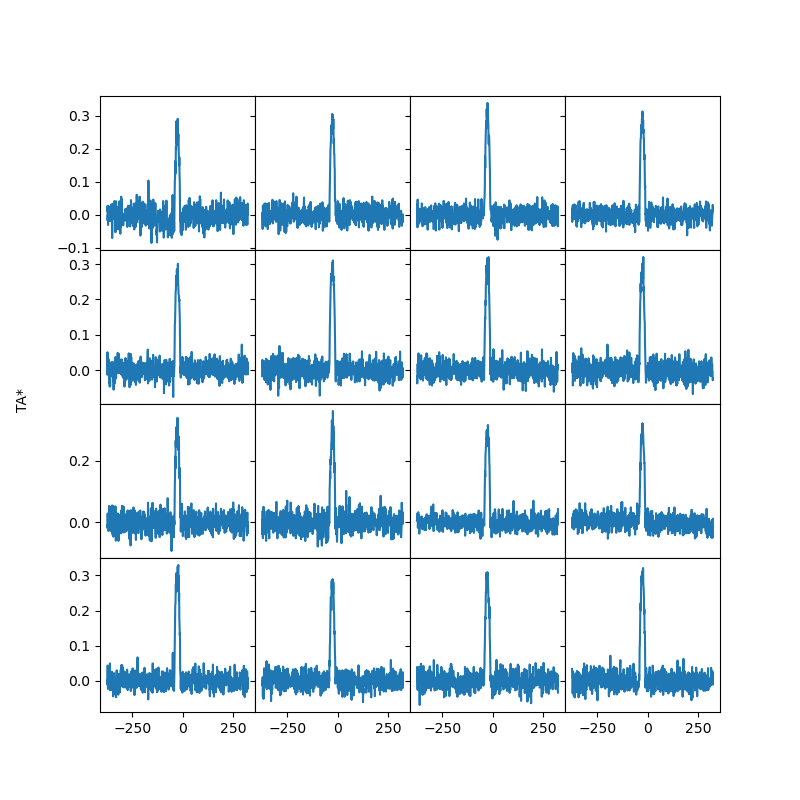
- mean_spectra_plot for each beam

- coverage as defined how often sky pixel was seen
(sky pixels are half of LMT beam size)

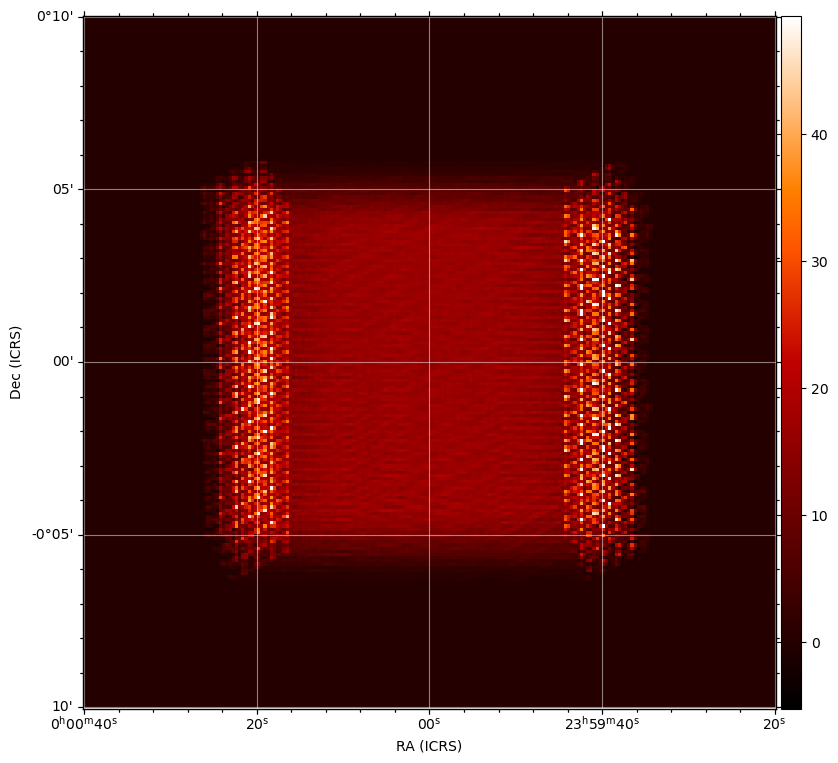
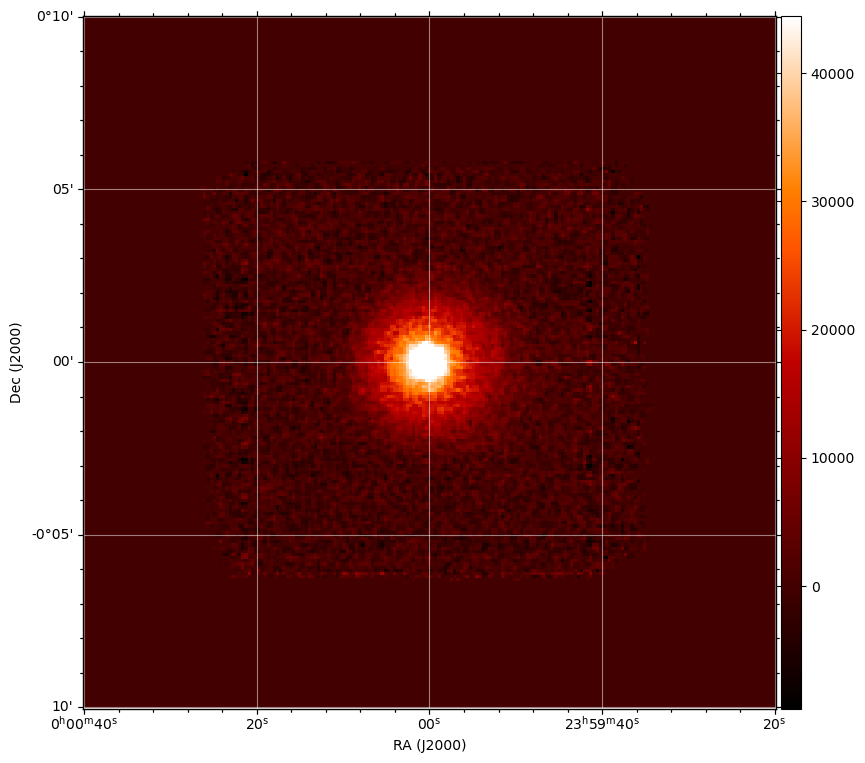
- moment-0 estimate (see also ADMIT)

Last updated Wed Mar 16 12:32:05 EDT 2022 on lma.astro.umd.edu