The Zpectrometer is an ultra-wideband spectrometer for the NRAO Green
Bank Telescope. Below you will find
A brief paper describing the Zpectrometer and its science goals
appeared in the Proceedings of a workshop held at the North American
ALMA Science Center in 2006 is available here.
More
information
is available below.
Recent news
The input hybrid on the Ka-band receiver has been changed to a 90
degree hybrid, with reduced receiver temperature and increased
bandwidth. The Zpectrometer system was released for general
observations in late October 2010.
Links
- Performance and data reduction notes and scripts:
- Test results and design notes
Images and descriptions
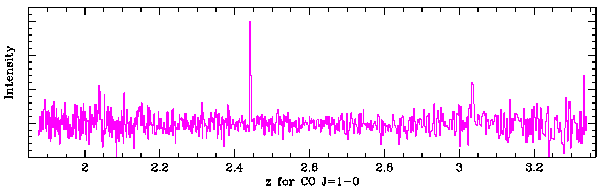
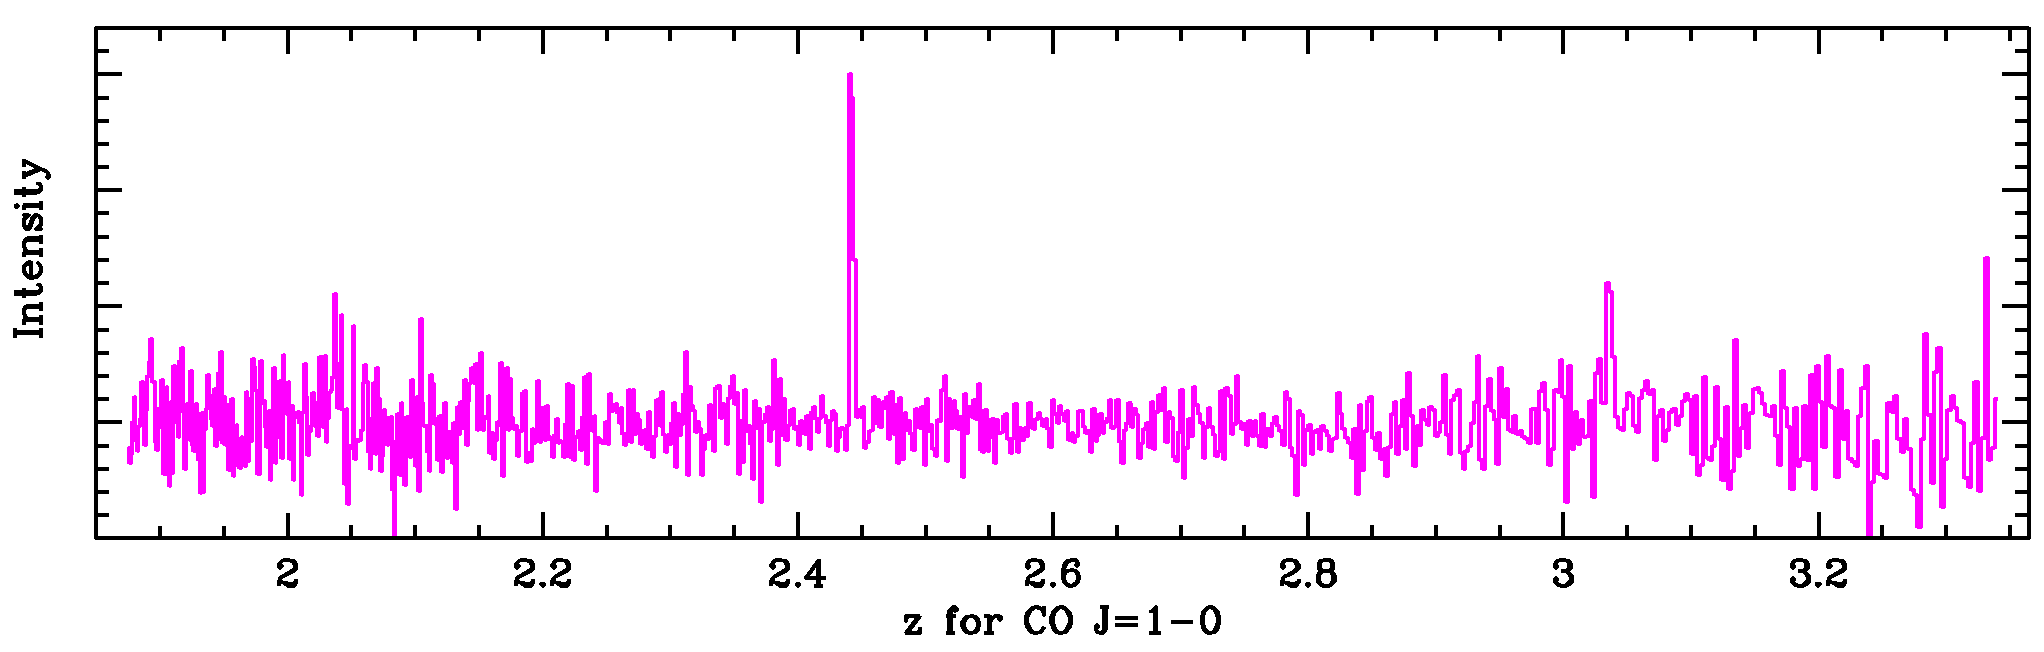
The Zpectrometer at the
100-meter diameter Green Bank
Telescope (GBT) will produce ultra-wideband spectra to search for
distant galaxies, such as this simulation of observations of the CO J = 1-0 line over redshifts of 1.9
to 3.4. This project is funded by the National Science
Foundation's Advanced Technology and Instrumentation program from
2005-2008. The proposal abstract (pdf)
contains
the
project goals. The spectrometer uses WASP2
analog lag correlators attached to
the GBT's Ka-band
correlation
receiver. Some of the important aspects of
multi-channel correlation spectroscopy are summarized here in a brief
paper (pdf, ps) titled Spectroscopy with Multichannel Correlation
Radiometers.
Minimalist design view of correlator dual-band chassis design with 16
correlator cards, power splitters to feed the cards (below cards),
separate downconverter and amplifier modules to both sides, control
computer, and phase switch drive card.
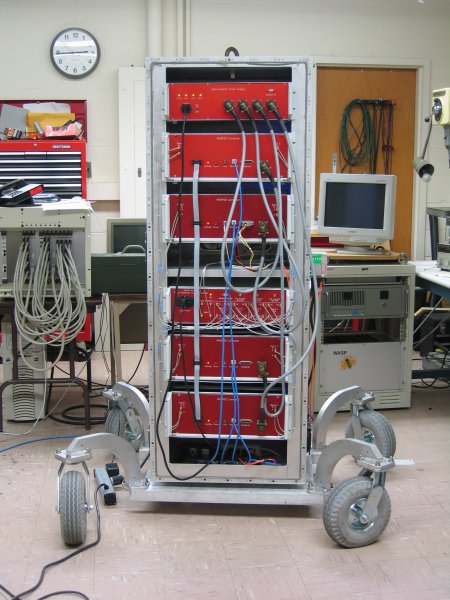
The Zpectrometer in the lab at Maryland. From top to bottom, the
chassis are the power supply, two correlators, the IF distribution box,
and two further correlators; network hubs and fiber conversion boxes
are at the very bottom. The enclosure, designed and
fabricated by NRAO Green Bank, is an effective RF shield when the front
door is closed. Putting the wheels on outriggers adds stability
and allows the enclosure to roll through standard height doors.
All of the cables attach to the individual chassis' front panels to
simplify the enclosure design (at the cost of adding some clutter when
the enclosure is open).
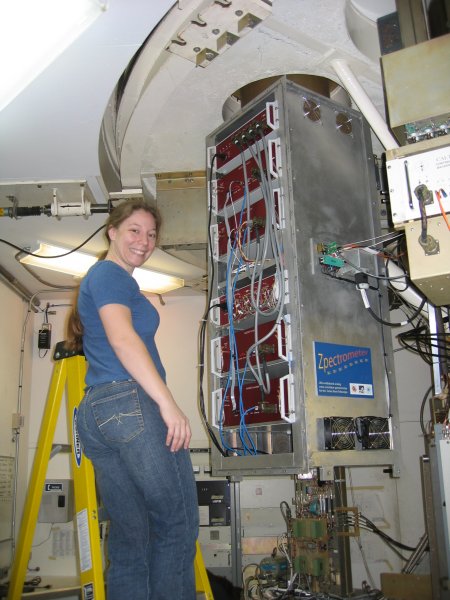
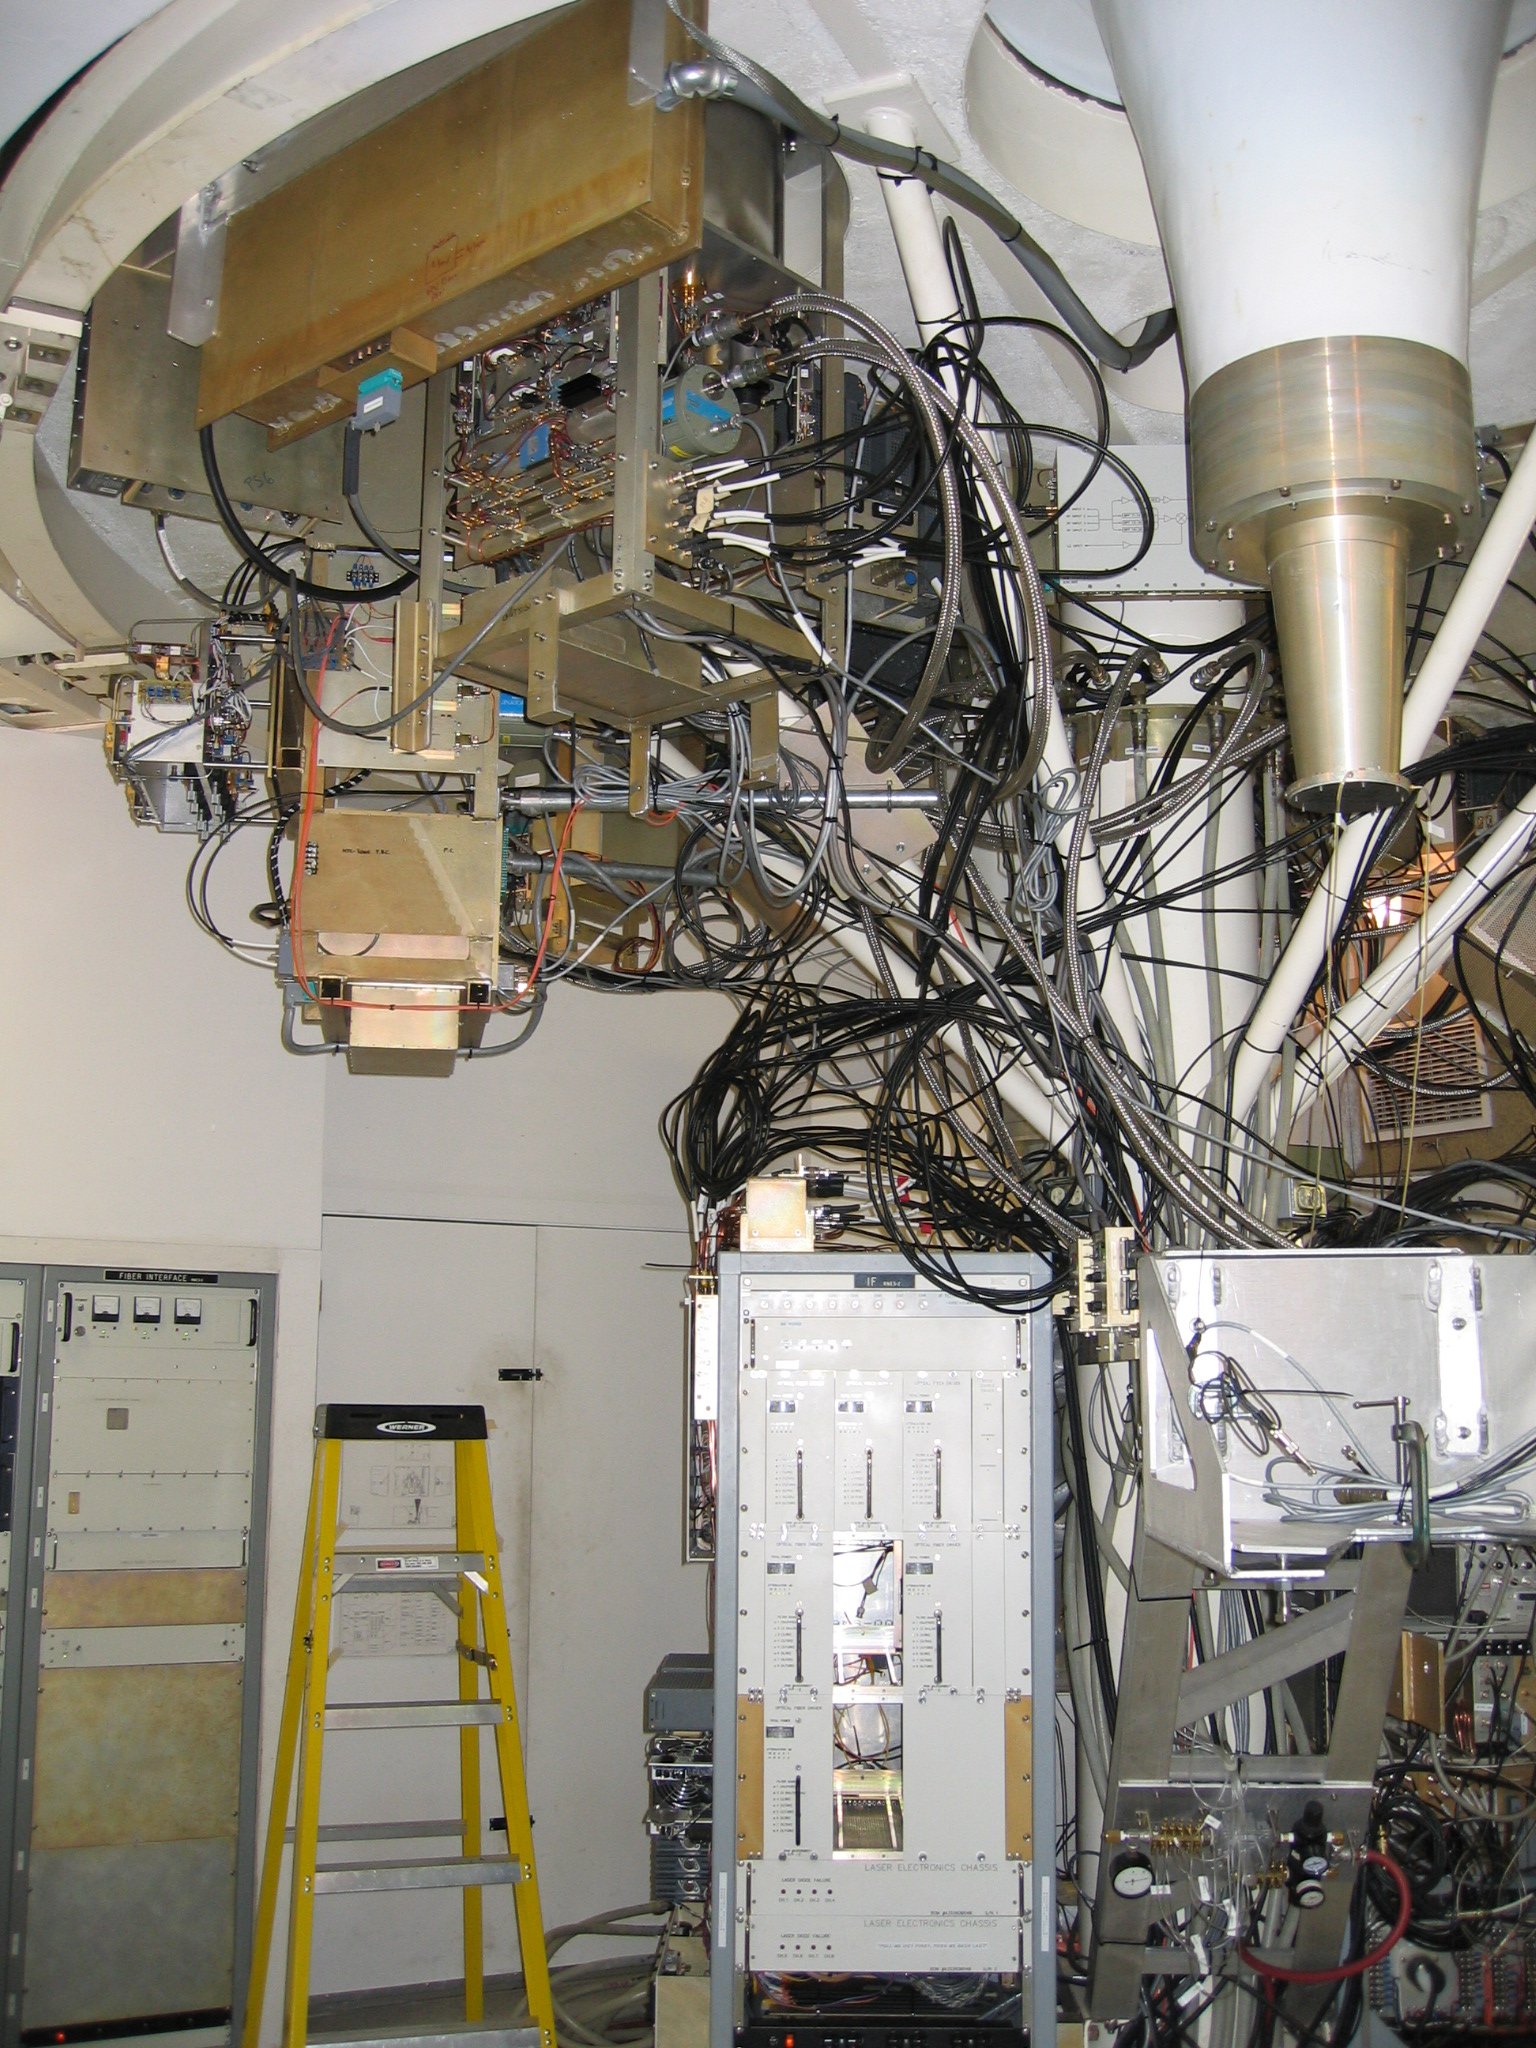
The Zpectrometer hangs on the GBT's receiver turret next to the Ka-band
front-end, which is just visible to the right.
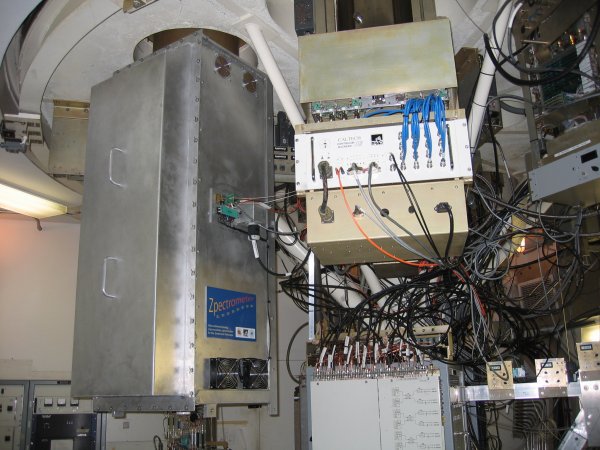
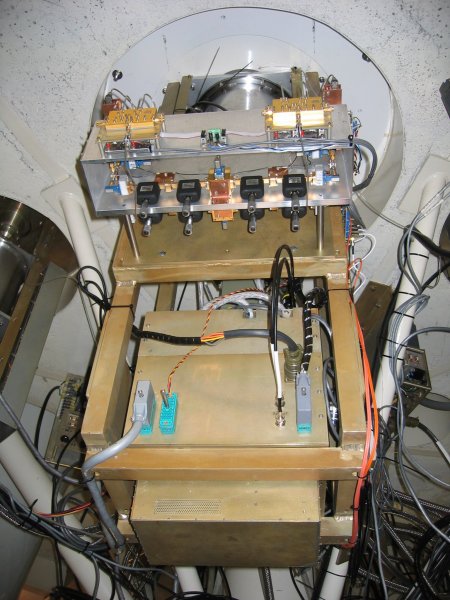
In operation the Zpectrometer is completely enclosed in its
shielded rack. The bottom of the Ka-band receiver and its Caltech
Continuum backend are clearly visible in this view.

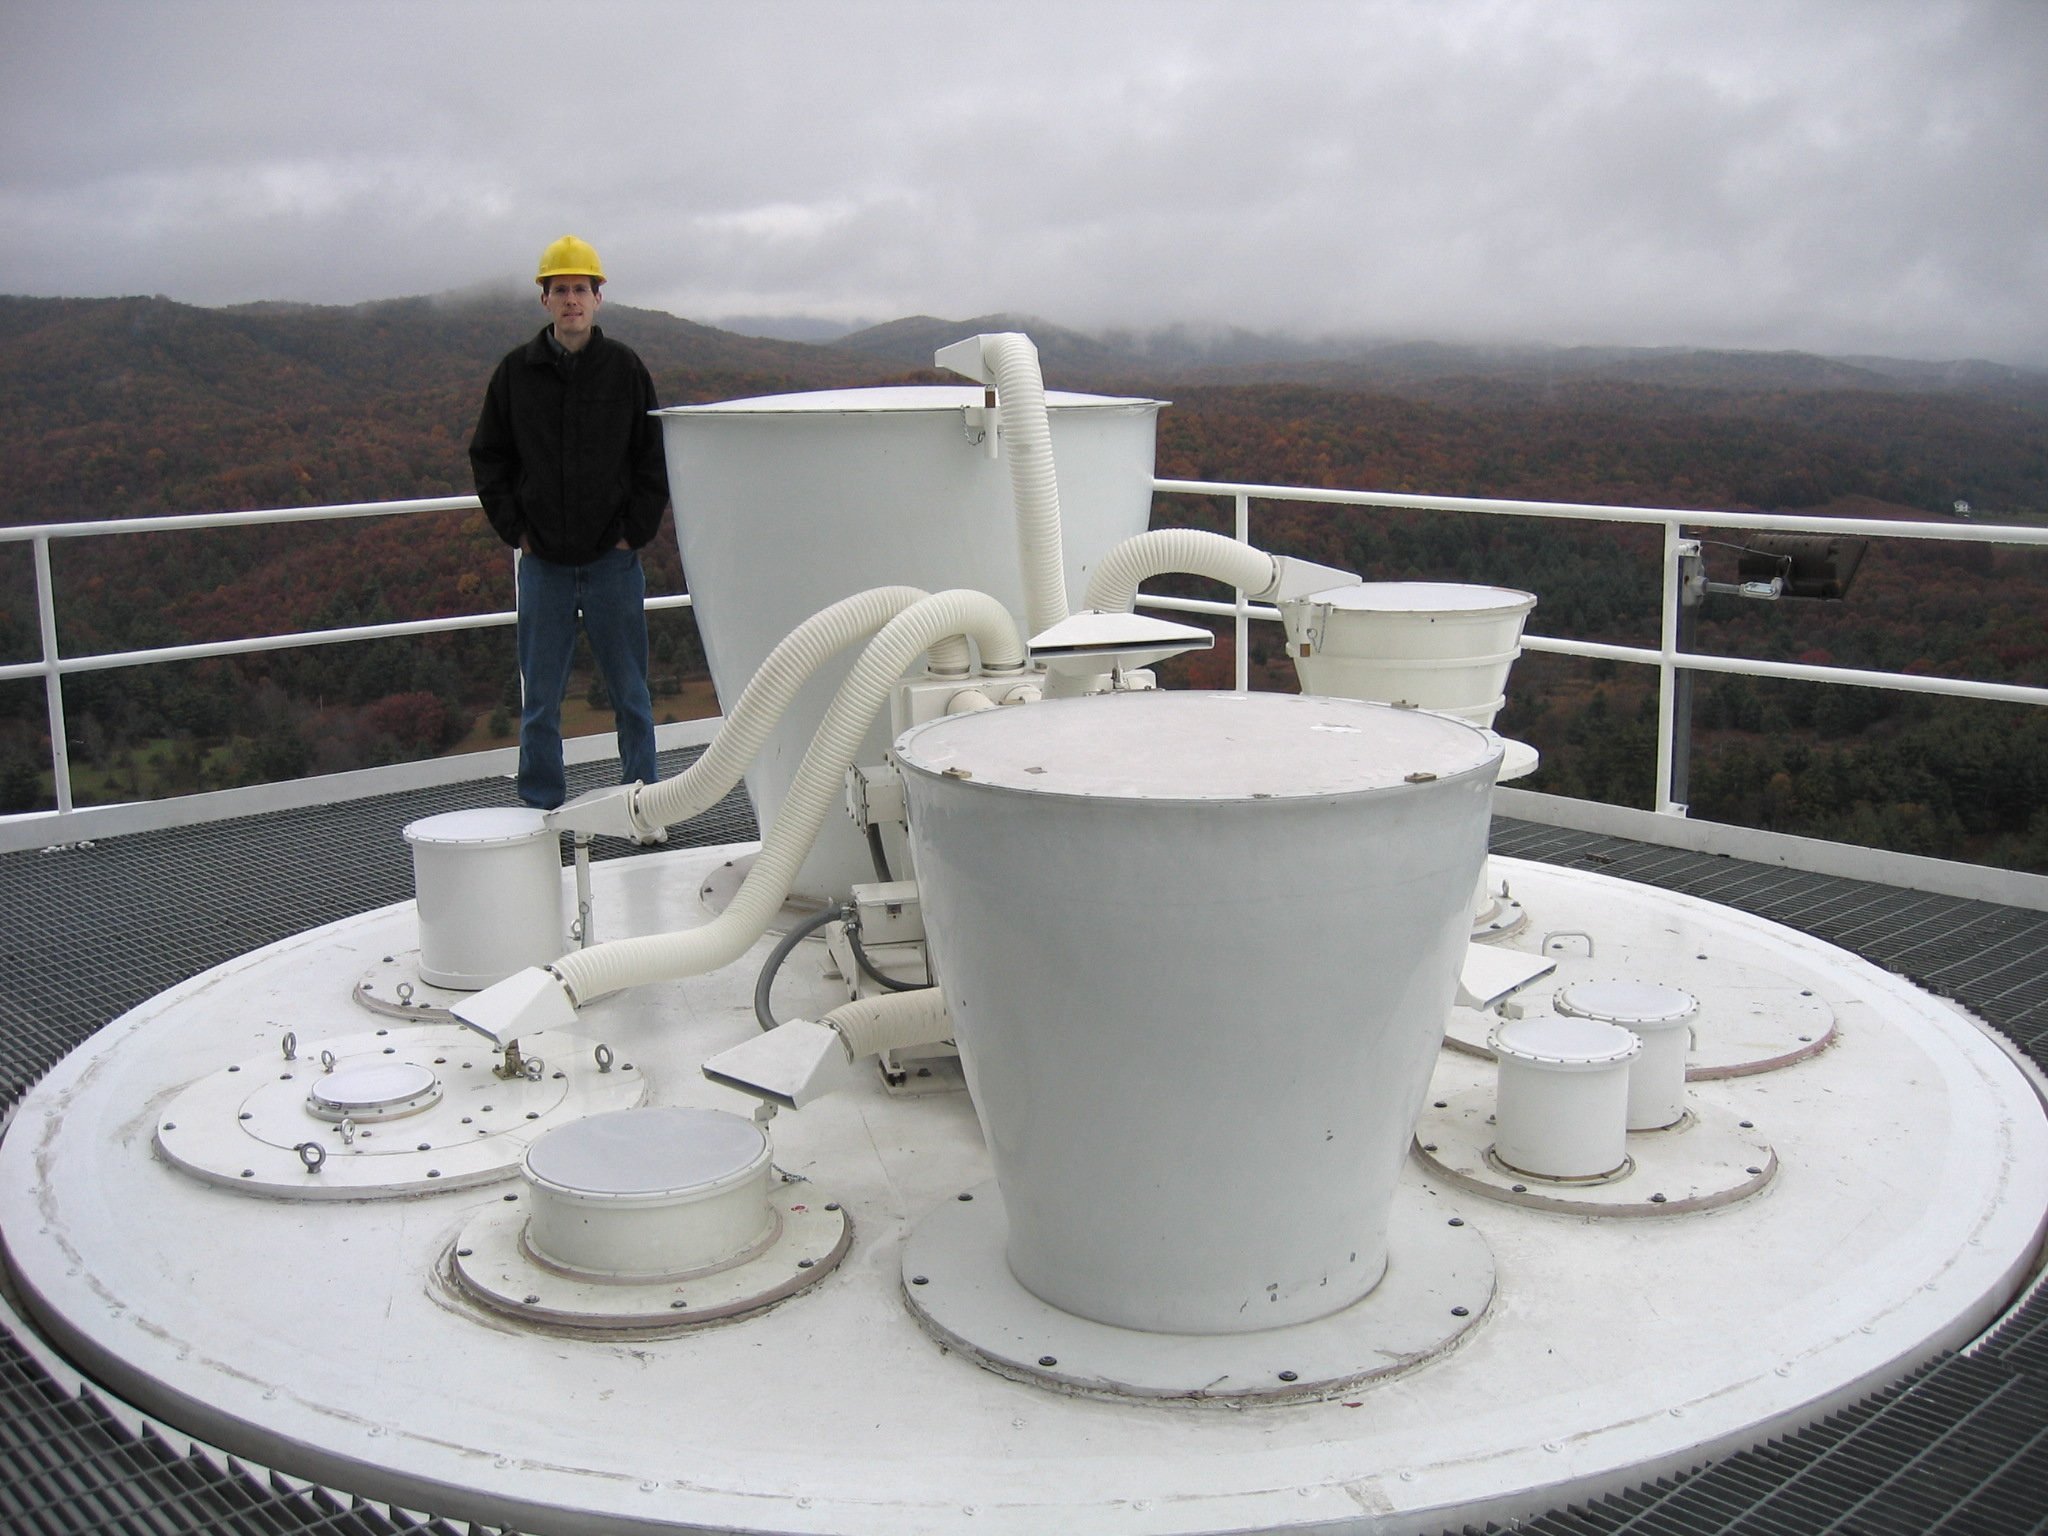
The top of the receiver turret carries the feed horns for the
GBT. The Ka-band feeds are under the white cover that is the
furthest to the left in this image. A set of hoses blows warmed
air across the covers to keep them dry.

The receivers seem to hang from the ceiling in the receiver
room;
they're actually on a large rotating "turret" that selects which one is
at the telescope focus. The Ka-band receiver is just above the
ladder.
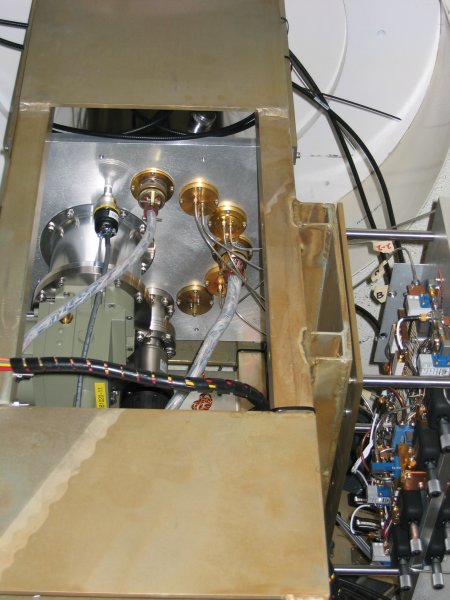
A good view of the Ka-band receiver electronics. The warm
microwave electronics are on the aluminum plates. It is easy to
recognize the micrometers for phase and amplitude adjusters for both
channels of both polarizations.
Here is a closeup of the bottom of the Ka-band receiver cryostat.
Galen, the receiver engineer, looks at the receiver
innards.
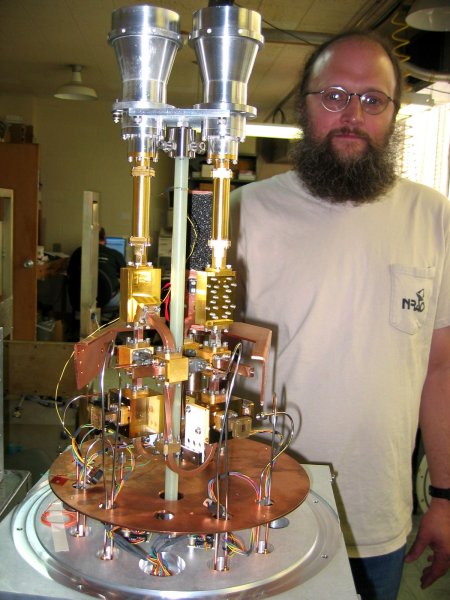
Although normally cooled to 20 K, this lab photo (courtesy H. Li) shows
the receiver cryostat open and warm in the lab during an earlier
visit. From top to bottom, one can see the feed horns, transition
sections, orthomode transducers that separate the polarizations,
cross-guide couplers for injecting calibration signals, and the magic
tee 180 degree hybrids. The amplifiers are off for testing.
Other pictures
of the inside of the cryostat are available in the NRAO pages.

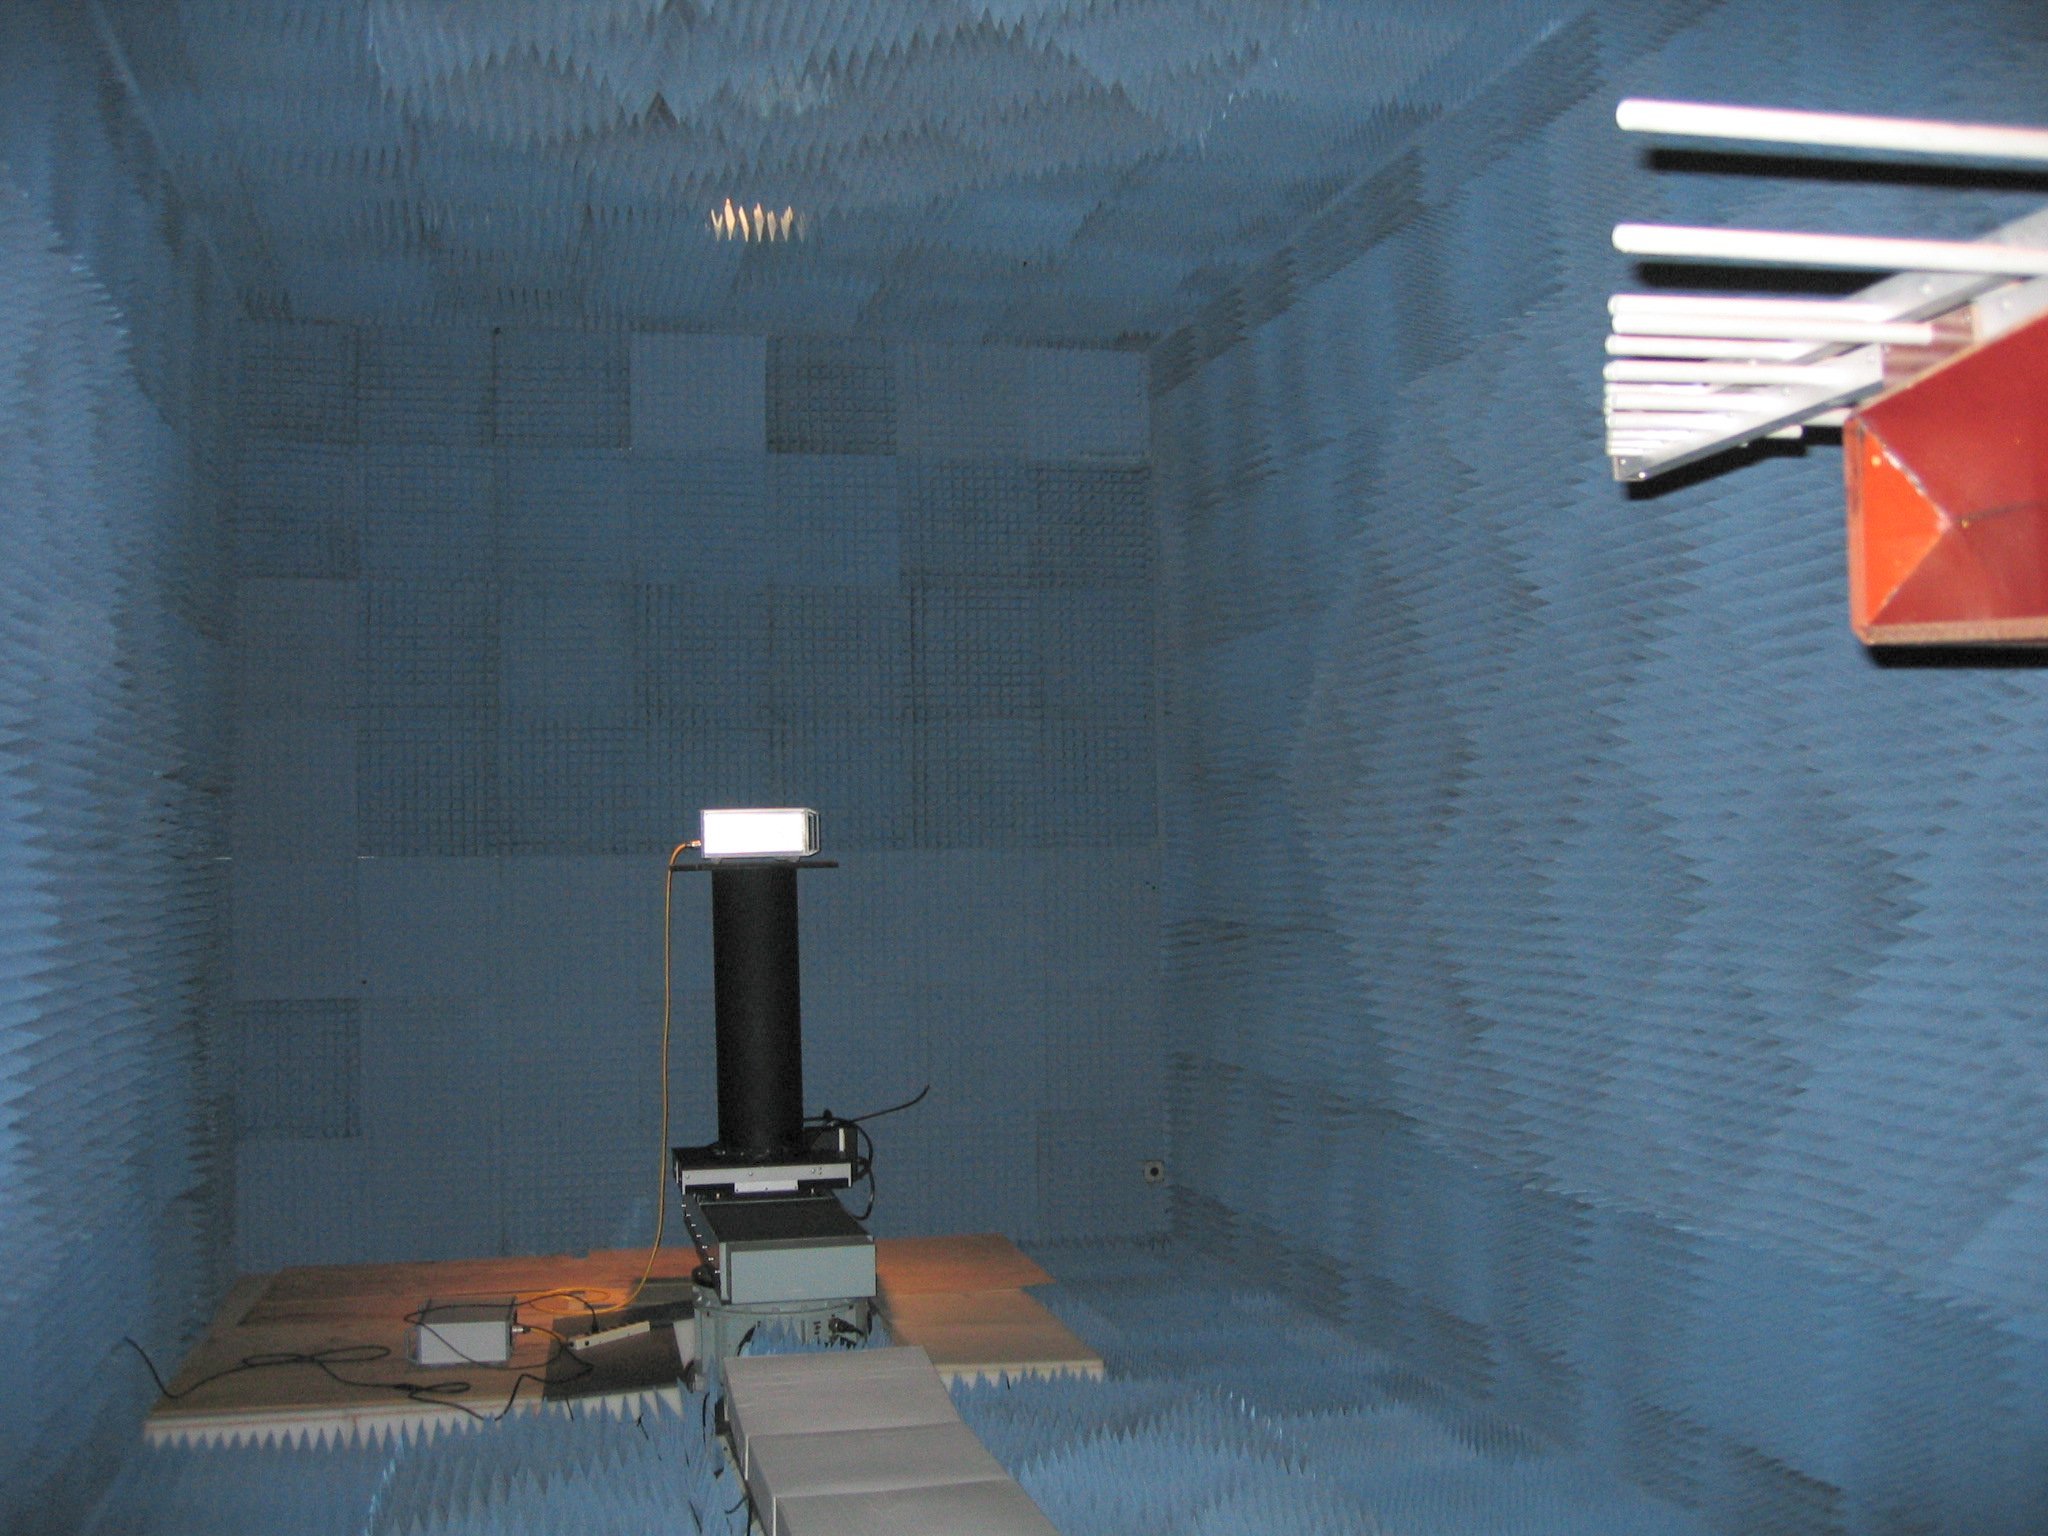
A WASP2 spectrometer in the Green Bank RF anechoic chamber to
measure
its radio and microwave emissions. The room itself is a
metal box with walls covered in blue RF-absorbing material.
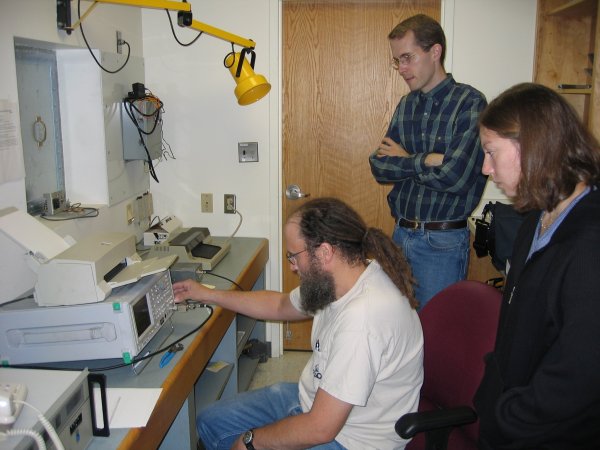
Concentrating on the spectrum analyzer display that shows the emission
spectrum from the spectrometer.
Questions or comments? Please contact Andrew Harris.