Supernova Explosions
Supernova & Cosmology
A Kepler Search for Supernovae
A Kepler-2 Search for Supernovae: Our White Paper and Beyond
A Kepler-2 Search for Supernovae: plus/minuses for the +/-V Observing directions
Consequences for Concurrent Ground-based Observations
Summary
Petition the K2 Team
In The News
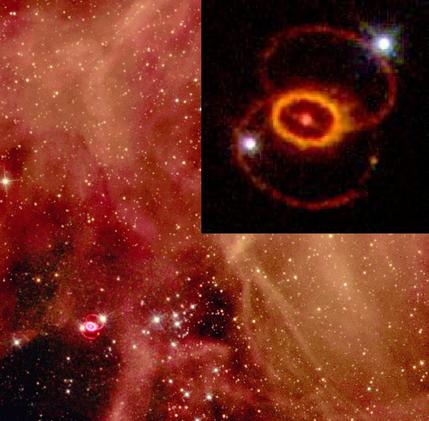

Supernova (SN) events have been observed throughout human history. The earliest surviving record of a supernova explosion stems from 185 AD. The supernova explosion observed in 1054 AD by Chinese, Japanese and Arab astronomers possibly being the most famous case because it was easily visible in daytime, yet completely missed by European observers. The best studied SN event was "SN 1987A," which occurred in the nearby "Large Magellanic Cloud" galaxy. SN 185 might have been a white-dwarf supernova (type Ia), SN 1054 and SN 1987A were core-collapse cases (type II). Supernovae are the source of all elements heavier than oxygen, including those critical for life as we know it (such as potassium, sodium, calcium, phosphorous, iron, zinc, ...).
The gross properties of the lightcurves of white-dwarf supernovae are determined by the properties of the radioactive elements produced in the explosion: the peak brightness is set by the amount of Nickel-56 that is synthesized; the lightcurve up to two weeks after maximum light is controlled by the decay of 56Ni (with a half-life of ~6 days) to Cobalt-56, which decays (1/2-life 77 days) to the stable iron-56. However, there is variability amongst the lightcurves of type Ia supernovae: fainter SNe decline faster, which is caused by a different physical mechanism. In fact, a number of physical processes (composition, temperature, binary status, expansion velocity, initial structure of the exploding star, ... ) affect the shapes of the lightcurves, but those effects are all folded together. To decode a lightcurve into the various contributors, one needs additional information such as temperature measurements and/or determinations of the composition, both as a function of time. Temperatures can be determined using color measurements: blue/white arises from hot objects, redder colors indicate lower temperatures.


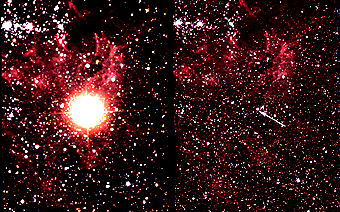
Image credits; Left) Rainbow above Kaviskis Lake, Lithuania [by Arz; http://commons.wikimedia.org/wiki/File:Rainbow_above_Kaviskis_Lake,_Lithuania.jpg]
I first saw the middle image
at "Write Science" at https://writescience.wordpress.com/tag/sph/ but
Middle & Right appear to be from:
http://www.umop.net/spctelem.htm
A new era (and see below) may be dawning in the study of supernova explosions with the advent of lightcurves as determined from high time-resolution data taken by NASA's Kepler mission, and, hopefully, soon with the K2 mission.
The record of exactly how the brightness of the SN event changes over time, or lightcurve, has proven to be of tremendous importance for our understanding as to how the universe has changed over time (cosmology). In the 1990s it became clear that for white-dwarf supernovae (type Ia), the lightcurves of Ia SNe are standardizable, meaning that the shape of the lightcurve can be used to determine what the intrinsic brightness of the supernova event was. Using the observed apparent brightness, one can then compute the luminosity distance to the SN: DL = √ intrinsic_brightness / (4*PI*apparent_brightness)
Another way to measure the distance to a galaxy that hosts the supernova, is through measuring the Doppler shift of the spectral lines from the galaxy. Because most galaxies appear to be moving away from us, the spectral lines are shifted towards the red part of the spectrum, and hence this effect is called the galaxy's redshift, or "z". In the 1920s Edwin Hubble used the recessional velocities (V) derived from the redshifts to estimate distances to nearby galaxies, such that Dz = V/H0, where H0 is the constant bearing Hubble's name: the Hubble constant. The equations that describe how the universe evolves over time follow from Einstein's theory of general relativity. From those relations, it follows that one can define distances in a number of ways (e.g., DL, Dz, ...). These distances depend in a different manner on the cosmological parameters that determine the state of the universe such as the amounts of baryonic matter, dark matter and dark energy, as well as the equation of state (w) of dark energy.
The distance measures arising from supernovae, when combined with the information such as those contained in the fluctuations of the micro-wave background radiation are a powerful tool to constrain cosmological parameters. While our current knowledge of cosmological parameters is rather good, scientists always strive for results with the highest possible levels of confidence. Currently, different experiments yield slightly different results (e.g. WMAP vs Planck), and those difference are likely due to "systematic uncertainties" in the various measurements. In order to get better determinations of the cosmological parameters, and especially the equation of state of dark energy, one now needs to painstakingly go after and eliminate the causes of those systematic errors. We anticipate that new Kepler/K2, high-resolution supernova lightcurves can substantially aid in the reduction of systematic errors in the SN part of the process.
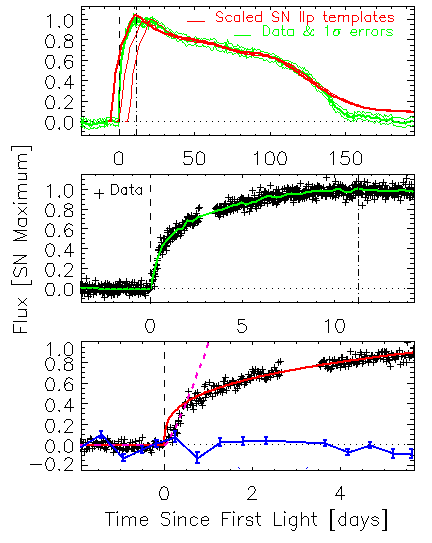
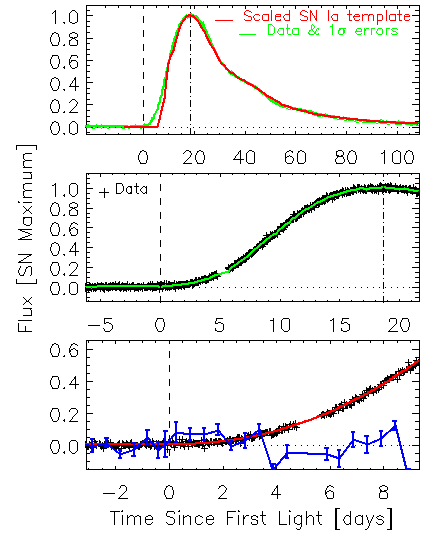
The Kepler satellite takes data roughly every 30 minutes. We have used these data to search for supernovae in a sample of roughly 400 galaxies. We found two likely core-collapse SN (type IIP; see left figure for an example) and three likely white dwarf SNe (type Ia; right figure) The data stream extends from well before to well beyond the duration of the SN events. Note the very steep rise in the light from this IIp supernova and the long steady decline: both typical for IIp cases. The quality of these lightcurves is about what we expect to obtain with the K2 mission (the proposed follow-up of the Kepler project).
Our KEGS team is putting an observing program together to observe supernovae with the K2 mission. Our White Paper describes the tremendous benefits that a large sample of supernovae with Kepler-like lightcurves would bring to supernova science such as our understanding of the progenitor and the physics of the explosion(see above). This data set could also provide essential data for more detailed calibration of SN Ia lightcurves for cosmological purposes (see above).
Significant benefits of SN observations with K2 would be realized if those SNe can be observed concurrently from observatories located here on Earth. Those observations would provide spectroscopic and photometric information that are crucial to our understanding of the supernova event such as the nature of the progenitor, or the type of binary that "pushed the white dwarfs over the limit" (see above). It is of the essence that these ground-based observations are obtained at the same time as K2 is taking its data.
The K2 mission is currently designed in such a way that it is relatively hard to obtain concurrent observations of the selected K2 fields, especially for the latter half of the observing periods. The relevant geometry is outlined in the figures below for two cases: 1) the standard K2 observing geometry, known as "−V" on the left, and the equivalent "+V" direction on the right. The geometry that applies at the reference time (TREF) is indicated in magenta, with the K2 S/C directly to the right of the Sun. At this time, K2's viewing direction (magenta arrow) is "straight down," in the clockwise direction along the tangent of K2's orbit. K2 will maintain this observing direction throughout a given observing campaign, or for about 82 days.
The "−V" figure indicates that 52 days before the reference time, K2 looks about 52 degrees outwards from the tangent of the orbit towards the target field of view. Likewise, at the end of the observing campaign 30 days after TREF, K2 needs to point about 30 degrees inwards from the tangent to see the same target area. These angles represent the physical limits between which K2 can maintain adequate pointing stability, and I use the same angles for an analysis of of the "+V" direction. [Note, the actual values of these in/outward angles are somewhat different due to K2's varying orbital speed: see figure caption below.]
Naively, the +V viewing direction would be 180 degrees ahead in ecliptic longitude from the −V direction, and at the opposite latitude. However, because K2 will observe longer before the reference time than after TREF, the computation of the location of the +V fields is slightly modified.
To maintain the observing cadence set by the K2 campaigns, any observing in the +V direction must also start 52 days before TREF and end 30 days after TREF. However, K2 is limited in its ability to view inwards of the tangent to the orbit, to ~30 degrees, which is drawn in the +V (right-hand) panel of the figure below. The corresponding viewing direction at TREF points about (52-30)=22 degrees outwards from the tangent (actually: 22 days * 0.966443 o/day = 21.26o). This means that the ecliptic longitude of the +V direction is not 180 degrees, but just (180-21.26)=158.7o ahead of the −V direction.

 For illustrative purposes, the pictures above are generated
assuming that K2 moves at one degree per day in its orbit, in the
counter-clockwise direction. However, on average K2 moves (360
degrees)/(372.5 days) = 0.966443 degrees/day, while the actual orbit
is elliptical. The left panel shows K2's standard "−V" observing
geometry. At the reference time (TREF) (magenta symbols in
figures), the "−V" observing direction corresponds to the downward
tangent to the orbit. At the start of an observing campaign
(TBEG), the S/C is located ~52o clockwise (cyan)
along the orbit. The dark-green cylinder is located at the end of an
observing campaign (TEND), ~30o ahead of the
reference location.
For illustrative purposes, the pictures above are generated
assuming that K2 moves at one degree per day in its orbit, in the
counter-clockwise direction. However, on average K2 moves (360
degrees)/(372.5 days) = 0.966443 degrees/day, while the actual orbit
is elliptical. The left panel shows K2's standard "−V" observing
geometry. At the reference time (TREF) (magenta symbols in
figures), the "−V" observing direction corresponds to the downward
tangent to the orbit. At the start of an observing campaign
(TBEG), the S/C is located ~52o clockwise (cyan)
along the orbit. The dark-green cylinder is located at the end of an
observing campaign (TEND), ~30o ahead of the
reference location.
To figure out how and when the target is visible from Earth, we need to change observing location from Kepler to the Earth. The figure shows that, for "−V" the angle between the target, Earth and Sun (ATES) is smaller than the angle between the target, Kepler and the Sun (ATKS) by the angle between Earth, Sun and Kepler (AESK). And so we get:
ATES = ATKS − AESK (−V direction)
ATES = ATKS + AESK (+V direction)
ATKS is larger (smaller) by the average angular rate for times before (after) the reference time. The location of Earth (light-green smiley face) is shown just once to avoid overcrowding of the figure. AESK is about 35, 41 and 47 degrees in mid 2014, mid '15 and mid '16, respectively. From the figures above it follows that IF ATES<0, THEN the target is above the horizon in daytime. For ATES>0, the target is visible at night night. The ATES values, scaled to hours, are shown in the figure below. Now there is enough information to compute the ATES angle for any time of the year, given a start, reference and end date of a K2 campaign. No celestial coordinates are required as would be the case for "regular" visibility calculations from an Earth-based observatory because the viewing direction is set by the K2 Mission Concept: towards anti-velocity at TREF and roughly in the ecliptic plane (β ~0o). The results are shown in the figures below: for all K2 campaigns on the left, and for the first 5 campaigns to the right.
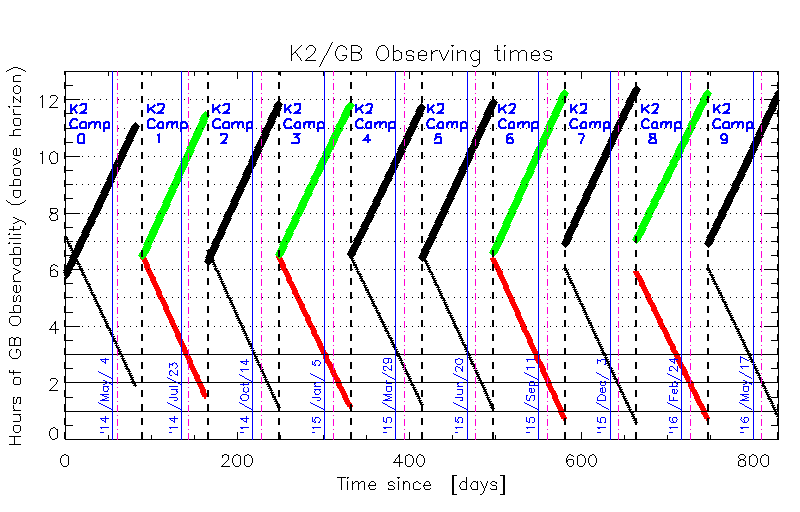
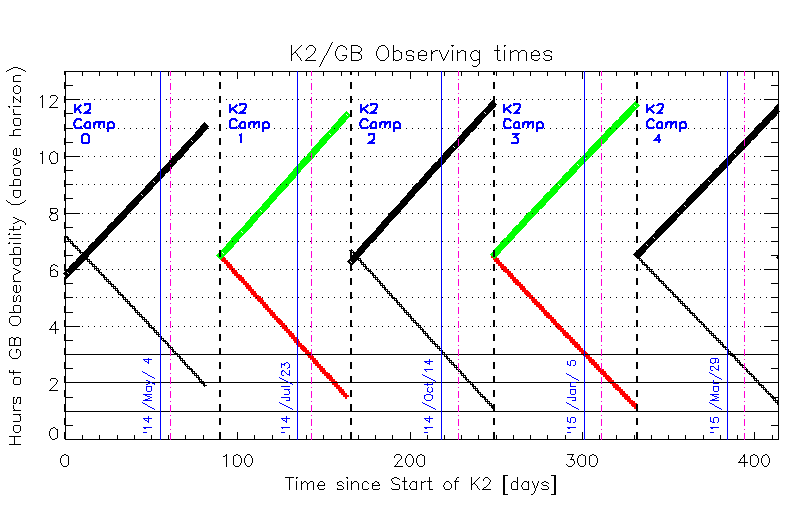 These figures show the number of hours that K2 targets are visible
from the Earth when the Sun is below the horizon, as a function
of time (horizontal axis). This number is just ATES/15,
since the Earth rotates 15 degrees per hour. The left-hand panel is
for all 10 K2 campaigns listed on the K2 website, the right-hand panel
for the first 5 campaigns through early 2015. The thick dashed
vertical lines denote the beginning and end of campaigns, the thin
blue (vertical) lines are drawn at the reference times. The
dash-dotted (magenta) lines are plotted 20 days before the end of each
campaign. The lines that slope downwards are for the −V
directions, the upwards sloping lines for the +V observing
geometry. UPDATE: start and end times are updated with info from the
K2 pages on 20140210.
These figures show the number of hours that K2 targets are visible
from the Earth when the Sun is below the horizon, as a function
of time (horizontal axis). This number is just ATES/15,
since the Earth rotates 15 degrees per hour. The left-hand panel is
for all 10 K2 campaigns listed on the K2 website, the right-hand panel
for the first 5 campaigns through early 2015. The thick dashed
vertical lines denote the beginning and end of campaigns, the thin
blue (vertical) lines are drawn at the reference times. The
dash-dotted (magenta) lines are plotted 20 days before the end of each
campaign. The lines that slope downwards are for the −V
directions, the upwards sloping lines for the +V observing
geometry. UPDATE: start and end times are updated with info from the
K2 pages on 20140210.
The figure above shows that for all campaigns, the K2 targets are visible for about 6 hours at the beginning of K2 campaigns towards the −V direction. This visibility decreases steadily by roughly 3.9 minutes/day and reaches 3 hours visibility roughly 30 days before the end of the K2 campaigns. In the +V direction, the targets would be visible for at least 6 hours every night. The three hour limit is important because this would give ground-based observers at least one hour of observing at elevations exceeding 30o (airmass=two). It becomes increasingly hard to obtain high quality observations from the ground as the airmass quickly increases towards lower elevation. High quality observations are needed to make substantial progress in the supernova science, both on the topic of explosion-related physics and for cosmological purposes. I have checked the above results by feeding the coordinates and dates of the first two K2 campaign fields to a visibility calculator for ground-based observatories. Due to the different locations and duration of the night for specific observatories, the results for a given observatory are not exactly as displayed in the figures above, but rather consistent. The difference can be up to ± one hour. Especially the downward adjustment of the visibility by ~1 hour when observing from Mauna Kea for the second campaign would put significant stress on "−V" GB observing campaigns.
IF K2 were to observe in the +V direction, concurrent ground-based observations would be possible for at least 6 hours every night. Furthermore, as K2 ends its campaign after 82 days, ground-based observatories can still see the SN event and continue following it till it fades away completely. This can not be done in the −V direction since the targets will become daytime objects towards the end of the K2 campaigns.
The field to observe has an area around 100 deg2, and so it takes some time to observe this from the ground. For example, the ATLAS Pathfinder program that we plan to use has a field of view of ~15 deg2, and would need 15 minutes per observation, leading to ~7 pointings or 1.6 hours of observing time, excluding calibrations. Due to its larger aperture, observing with PanSTARRS PS1 would be quicker, maybe 20 mins per K2 field.
A disadvantage of the +V direction is that sometimes the Earth enters K2's field of view. As seen from K2, Earth is very bright, with apparent magnitude of about -3.8 (per mid 2014). Such bright "stars" can cause significant artifacts in seemingly unrelated parts of the field of view. For example, cross-talk between the electronics can create artificial images on three other CCD outputs in addition to the real image (typical amplitudes are ±0.01× the real source). Likewise, due to reflections of the Schmidt corrector plate, ghost images appear diametrically opposite the field center from the original at amplitudes a few parts per 10,000. And there is the column anomaly. Overall, these artifacts are responsible for about 30% of potential Kepler planet candidates. [Kepler has 42 ~1x2k CCDs, arranged in 21 ~2x2k modules, where each module is read out with 4 outputs, for a total of 84 ~1x1k CCD outputs.]
However, these effects seem mostly limited to the CCD module on which the Earth would be detected and on its antipodal equivalent, or on two out of 21 modules (9.52%). Furthermore, the Earth would be traversing the FOV at a rate of ~0.966 o/day. The average diameter of K2's FOV is 14.2o, so it takes Earth 14.7 days to cross the FOV. Thus, maximally 14.2 out of 82 days (17.3%) of a campaign would be affected [this assumes that the transit of the Earth across the FOV goes through the field center: the worst case scenario.] And so, just 9.65%×17.3%=1.6% of the total number of observations would be affected by the Earth. For a specific source, the stats are somewhat worse: it is affected when the Earth lands on its module, and its antipodal equivalent, each roughly 2.2o in diameter. Thus, since it takes ~2.3 days to cross a module, a maximal loss of 2x2.3/82=5.6% of the data samples would occur for an individual source that happens to lie on the 2.2o wide path that Earth takes across K2's FOV.
The above analysis neglects the fact that the wide tails of the point spread function will leak over onto other CCD modules and would hence also affect the photometry. Coughlin et al. estimate that those wings extend a thousand arcsec, or roughly a quarter of a CCD output. The effects for the Earth would be larger (since it is brighter), so lets call it 4,000", or one CCD output. On the other hand, that also implies that not the whole, but may just 1/4th of a CCD module would be affected by PSF tails. These effects may counter each other, more or less.
The considerations heretofore are made without detailed knowledge of the operation of the Kepler spacecraft. Therefore it is possible that the above arguments will not survive contact with the nitty-gritty details of actual K2 operations. In that case, we will make the very best of the opportunities that −V observations of K2 supernovae offers. K2 can observe 10-20 thousand targets per campaign. A supernova
search would be effective if 5-15 thousand galaxies can be observed
per campaign. That is, if 25-75% of the K2 targets would be dedicated
to the SN search. This is a substantial fraction of the available
time. We feel that this could be justified since the return in number
of detected supernovae would also be large. Given the approximate
detection rate of 1 SN per galaxy per century in our existing Kepler
data, a survey of 10k galaxies for 70 days would yield
(70/365/100)*(5k--15k) ~ 10--30 supernovae per K2 Campaign. [I
use 70 days rather than the campaign duration of 82 days since, so as
to obtain a relevant K2 lightcurve, the SN event needs to be observed
for at least ~12 days after "first light."]
Our KEGS team is actively pursuing ground based observations
for future K2 targets. We believe that it would be good if other SN
teams would join us in pursuing ground-based observations of K2
supernovae, both to densify the observational cadence, and to enable
cross calibrations of the methodology of the various teams.
Specifically, at this point in time we suggest a +V
alternative to the current K2 Campaign fields towards the North and
South Galactic Cap regions. These alternative lie in the opposite
Galactic cap region: North(−V) --> South(+V) and similarly,
South(−V) --> North(+V). The details of the switch are
governed by K2's requirement that observations span [-52, +30] days
around the reference times as
explained above, that is to say that the equivalent +V
directions are obtained by adding 158.7 degrees in ecliptic longitude
to the −V directions, while keeping the ecliptic latitude
fixed.
The standard K2 fields for for campaings #1 and #3 are:
[λ,β](−V;#1) = [173.88, -1.11]o ;
[α,δ](−V;#1) = [173.94, 1.42]o ;
[l,b](−V;#1) = [264.55, 58.53]o
[λ,β](−V;#3) = [332.86, -1.25]o ;
[α,δ](−V;#3) = [335.27, -11.62]o ;
[l,b](−V;#3) = [ 49.23, -51.50]o
(see: the PROPOSED
K2 CAMPAIGN FIELDS section at the K2 mission page).
The equivalent K2 Campaign #1 in the +V direction is: [λ,β](+V;#1) =
[λ,β](−V;#1) + [158.7, 0] = [332.61, -1.11],
which
corresponds to [α,δ](+V;#1) = [334.98, -11.57 ] and Galactic
coordinates [l,b](+V;#1) = [49.07, -51.23].
The equivalent K2 Campaign #3 in the +V direction is: [λ,β](+V;#3) =
[λ,β](−V;#3) + [158.7, 0] = [131.60, -1.25],
which
corresponds to [α,δ](+V;#3) = [133.70, 16.10] and Galactic
coordinates [l,b](+V;#3) = [211.39, 34.39].
As outlined above and in our
White Paper, the K2 mission can be very effective in obtaining
lightcurves for supernova candidates. K2 lightcurves are significantly
more valuable when obtaining concurrent ground-based observations. It
is possible to obtain such GB observations if K2 were to observe the
−V direction, but in less favorable observing conditions, and
only for the first ~50 days of the K2 campaigns. If K2 were to observe
in the +V direction, ground-based observations are much easier to
schedule and the supernova events can be followed from the ground well
beyond the time that K2 switches over to a new target location. The K2
supernova lightcurves would be much more valuable when high-quality
concurrent ground-based observations are executed.
Some aspects of our team's results and proposed SN observations with
K2 have been described in:
3) UMd-astro
news room (Jan 2014),
2) Science News (Jan 2014),
1) Nature News (Jan 2014)
- The Nature News article was also re-posted at the 1b) Huffington Post.
- The Nature News article was also re-posted at the 1c) Daily News.
- The Nature News article was extensively referred to in 1d) Ezine Articles.
- The Nature News article was extensively referred to in 1e) Softpedia News.
- Supenova as part of the K2 mission we mentioned in: 1f) TIME: Science & Space.